Generating Contours in PixElement

In this article, we will be looking at how to create contours in the survey canvas. Please see the video tutorial of this below:
Creating Contours in PixElement
Understanding terrain elevation is crucial for surveying, construction, and land development. Contour lines provide a clear, visual representation of elevation changes, making it easier to analyze slopes, drainage patterns, and terrain features. In this tutorial, we’ll walk through the process of generating contours in PixElement, from creating a Triangulated Irregular Network (TIN) to exporting contour data for further analysis.
Generating a TIN for Contour Extraction


Before generating contours, you need to create a TIN. You can do so by creating a GRID and then generating a TIN from that area. You are also able to generate a TIN via the Generate TIN tool.
Within the TIN tool menu, you can choose to generate a TIN from the entire dataset (Bare Earth).


You are also able to select specific features, such as grids that have already been annotated to merge together into one TIN.


Once the selection is made, click Generate Automatic Outline down in the left hand bottom Features to Triangulate Menu, then, once that has processed, hit Triangulate Selection up on the right top TIN selection submenu to create the TIN.
What is a TIN?

A Triangulated Irregular Network (TIN) is a type of vector-based spatial data structure used to represent continuous surfaces through interconnected triangles. Unlike regular raster grids, which use evenly spaced elevation points, TINs can adapt to variations in terrain by using irregularly spaced points, making them more efficient for representing complex landscapes. Since TINs use irregularly spaced points, they work well with dense point clouds from UAS and airborne surveys, allowing for detailed and precise terrain reconstruction without excessive data overhead.
How TINs Work
- A TIN is constructed by connecting elevation points (nodes) to form a network of non-overlapping triangles.
- These triangles adapt to variations in terrain, allowing for a more accurate representation of features such as ridges, valleys, and steep slopes.
- The density of points is typically higher in areas with rapid elevation changes and lower in flatter regions.
Generating Contours

Navigate to the Contours submenu to generate the contours. Here, you can:
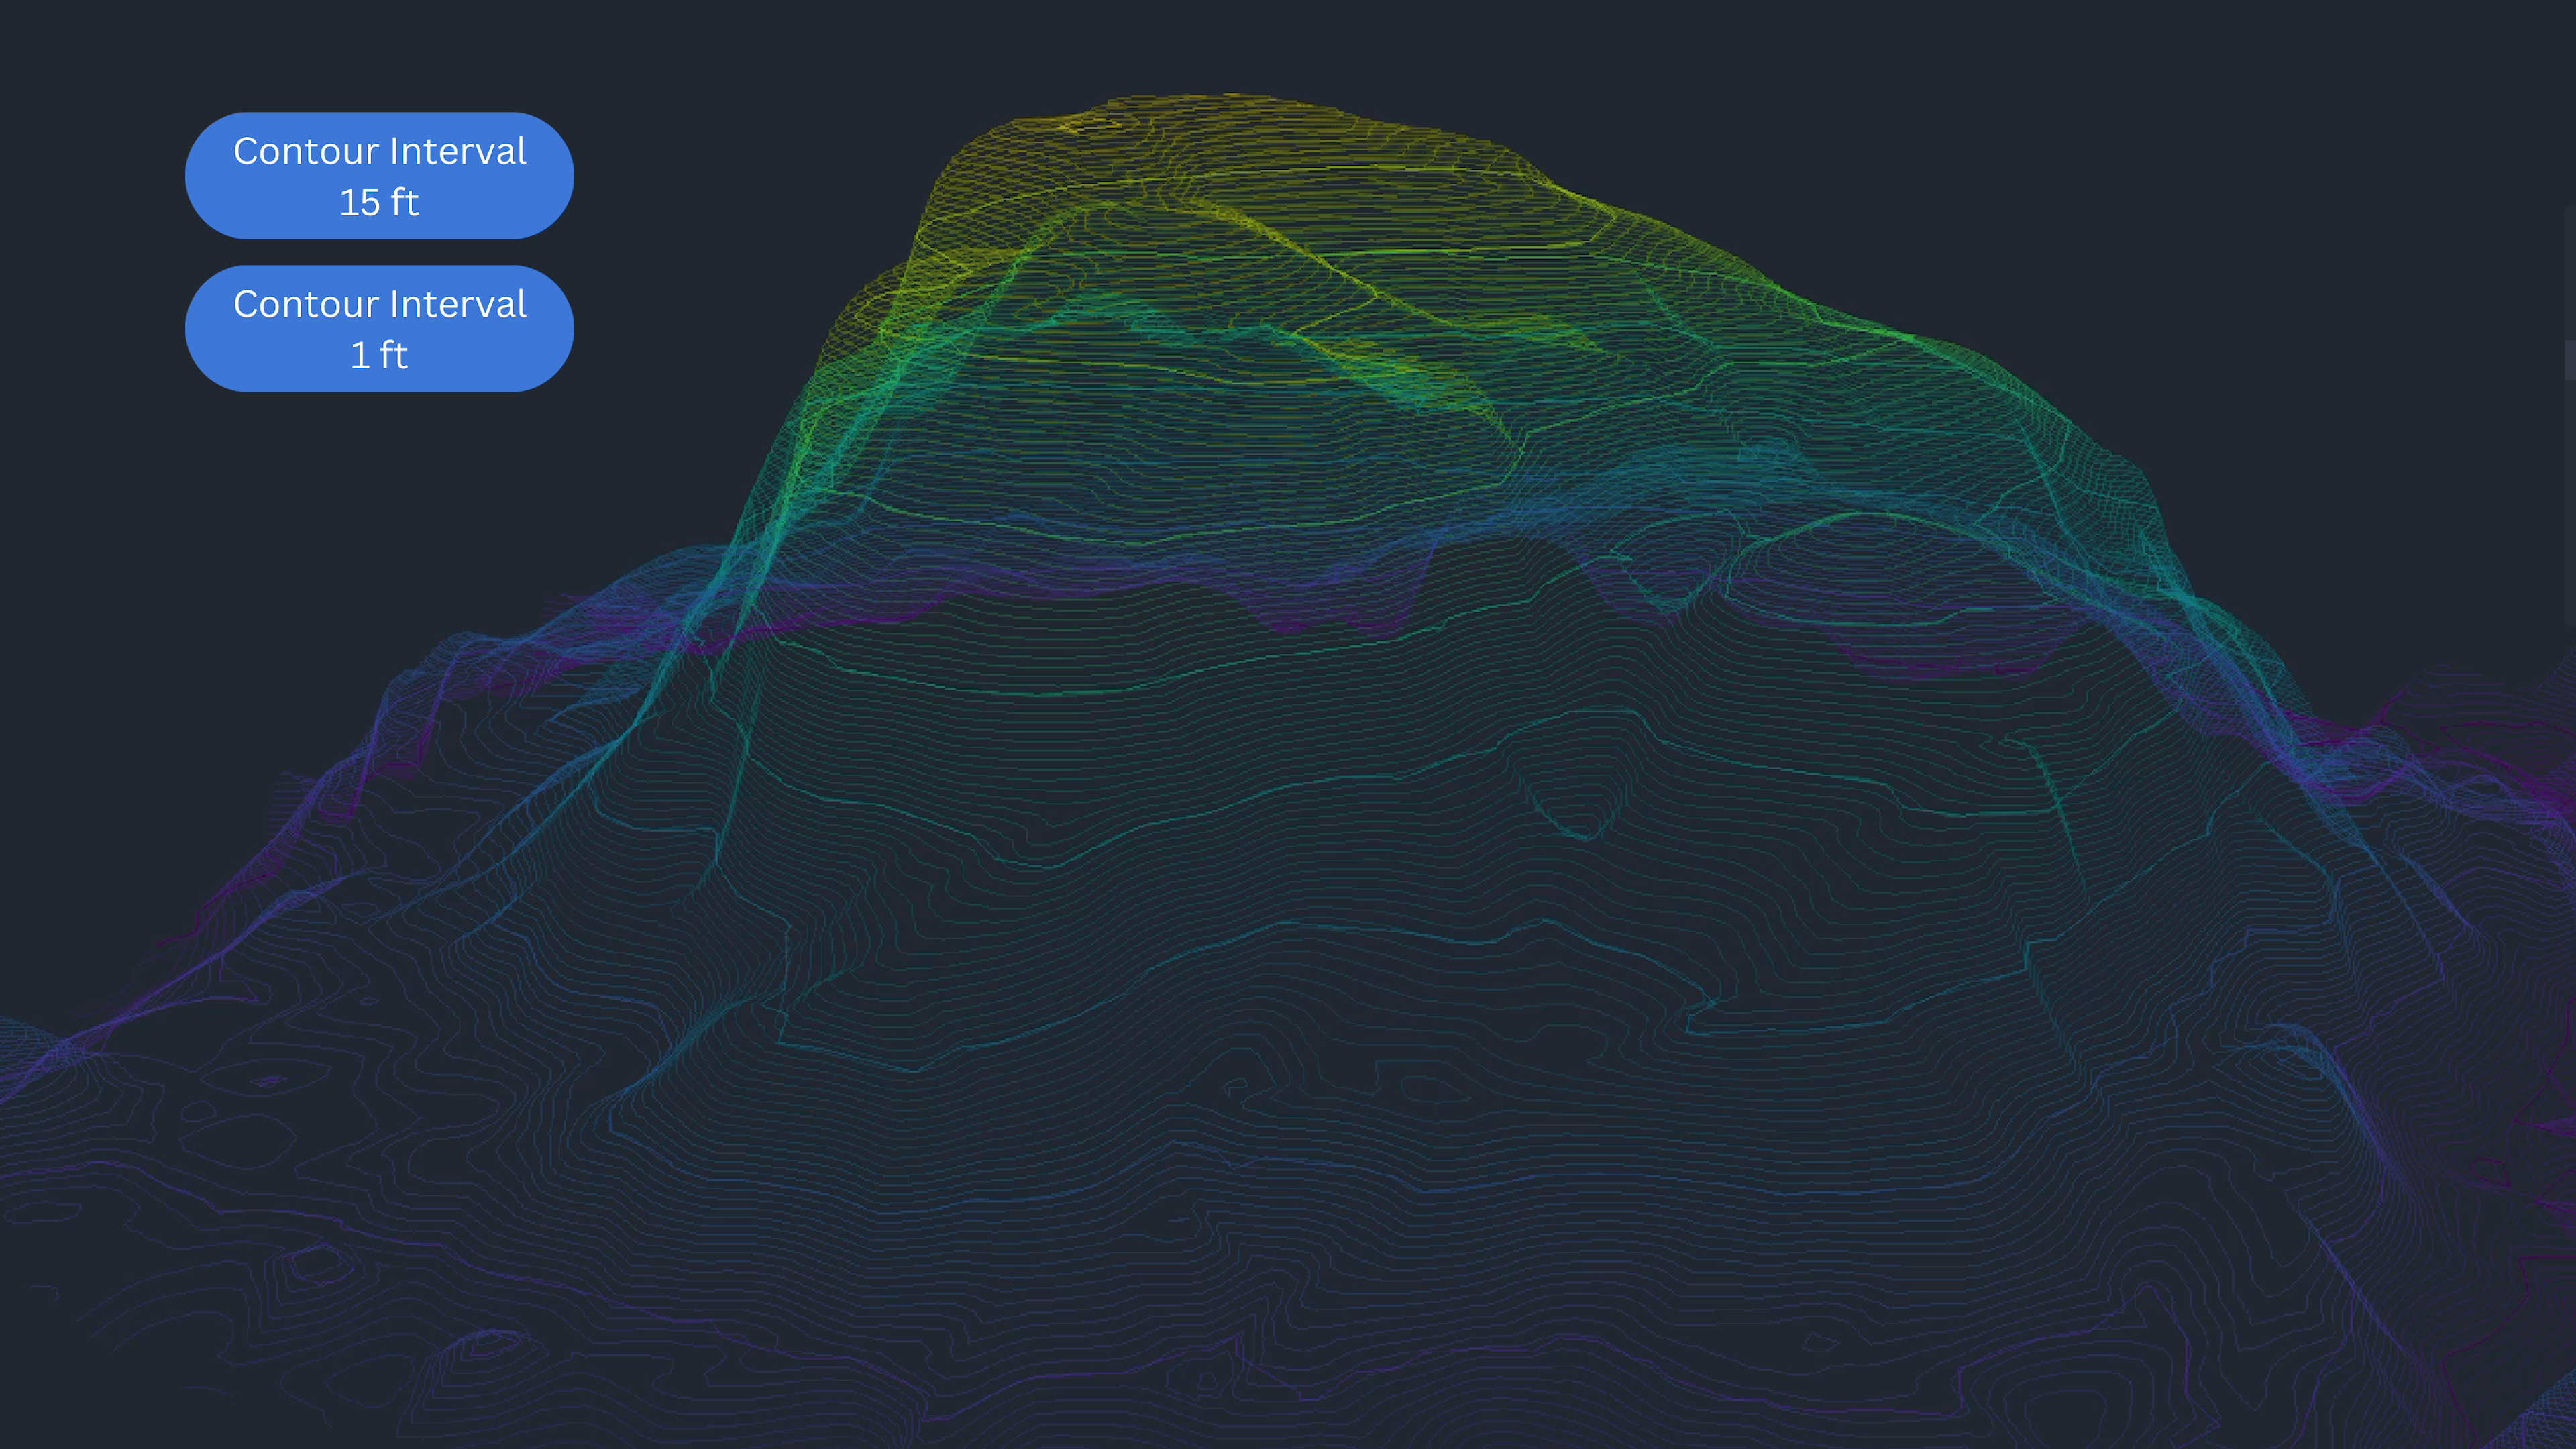
- Adjust the Contour Interval to customize how frequently elevation lines appear. In the example below, we have set the intervals to display contours every one foot, and then also contours every 15 feet to show the difference of options available.
- Set the Z Maximum and Minimum Elevation to generate your contour lines at. To get a better understanding of the specific elevations of your dataset, you can create a polyline and view the elevation profile in the profile viewer tool to set your parameters.
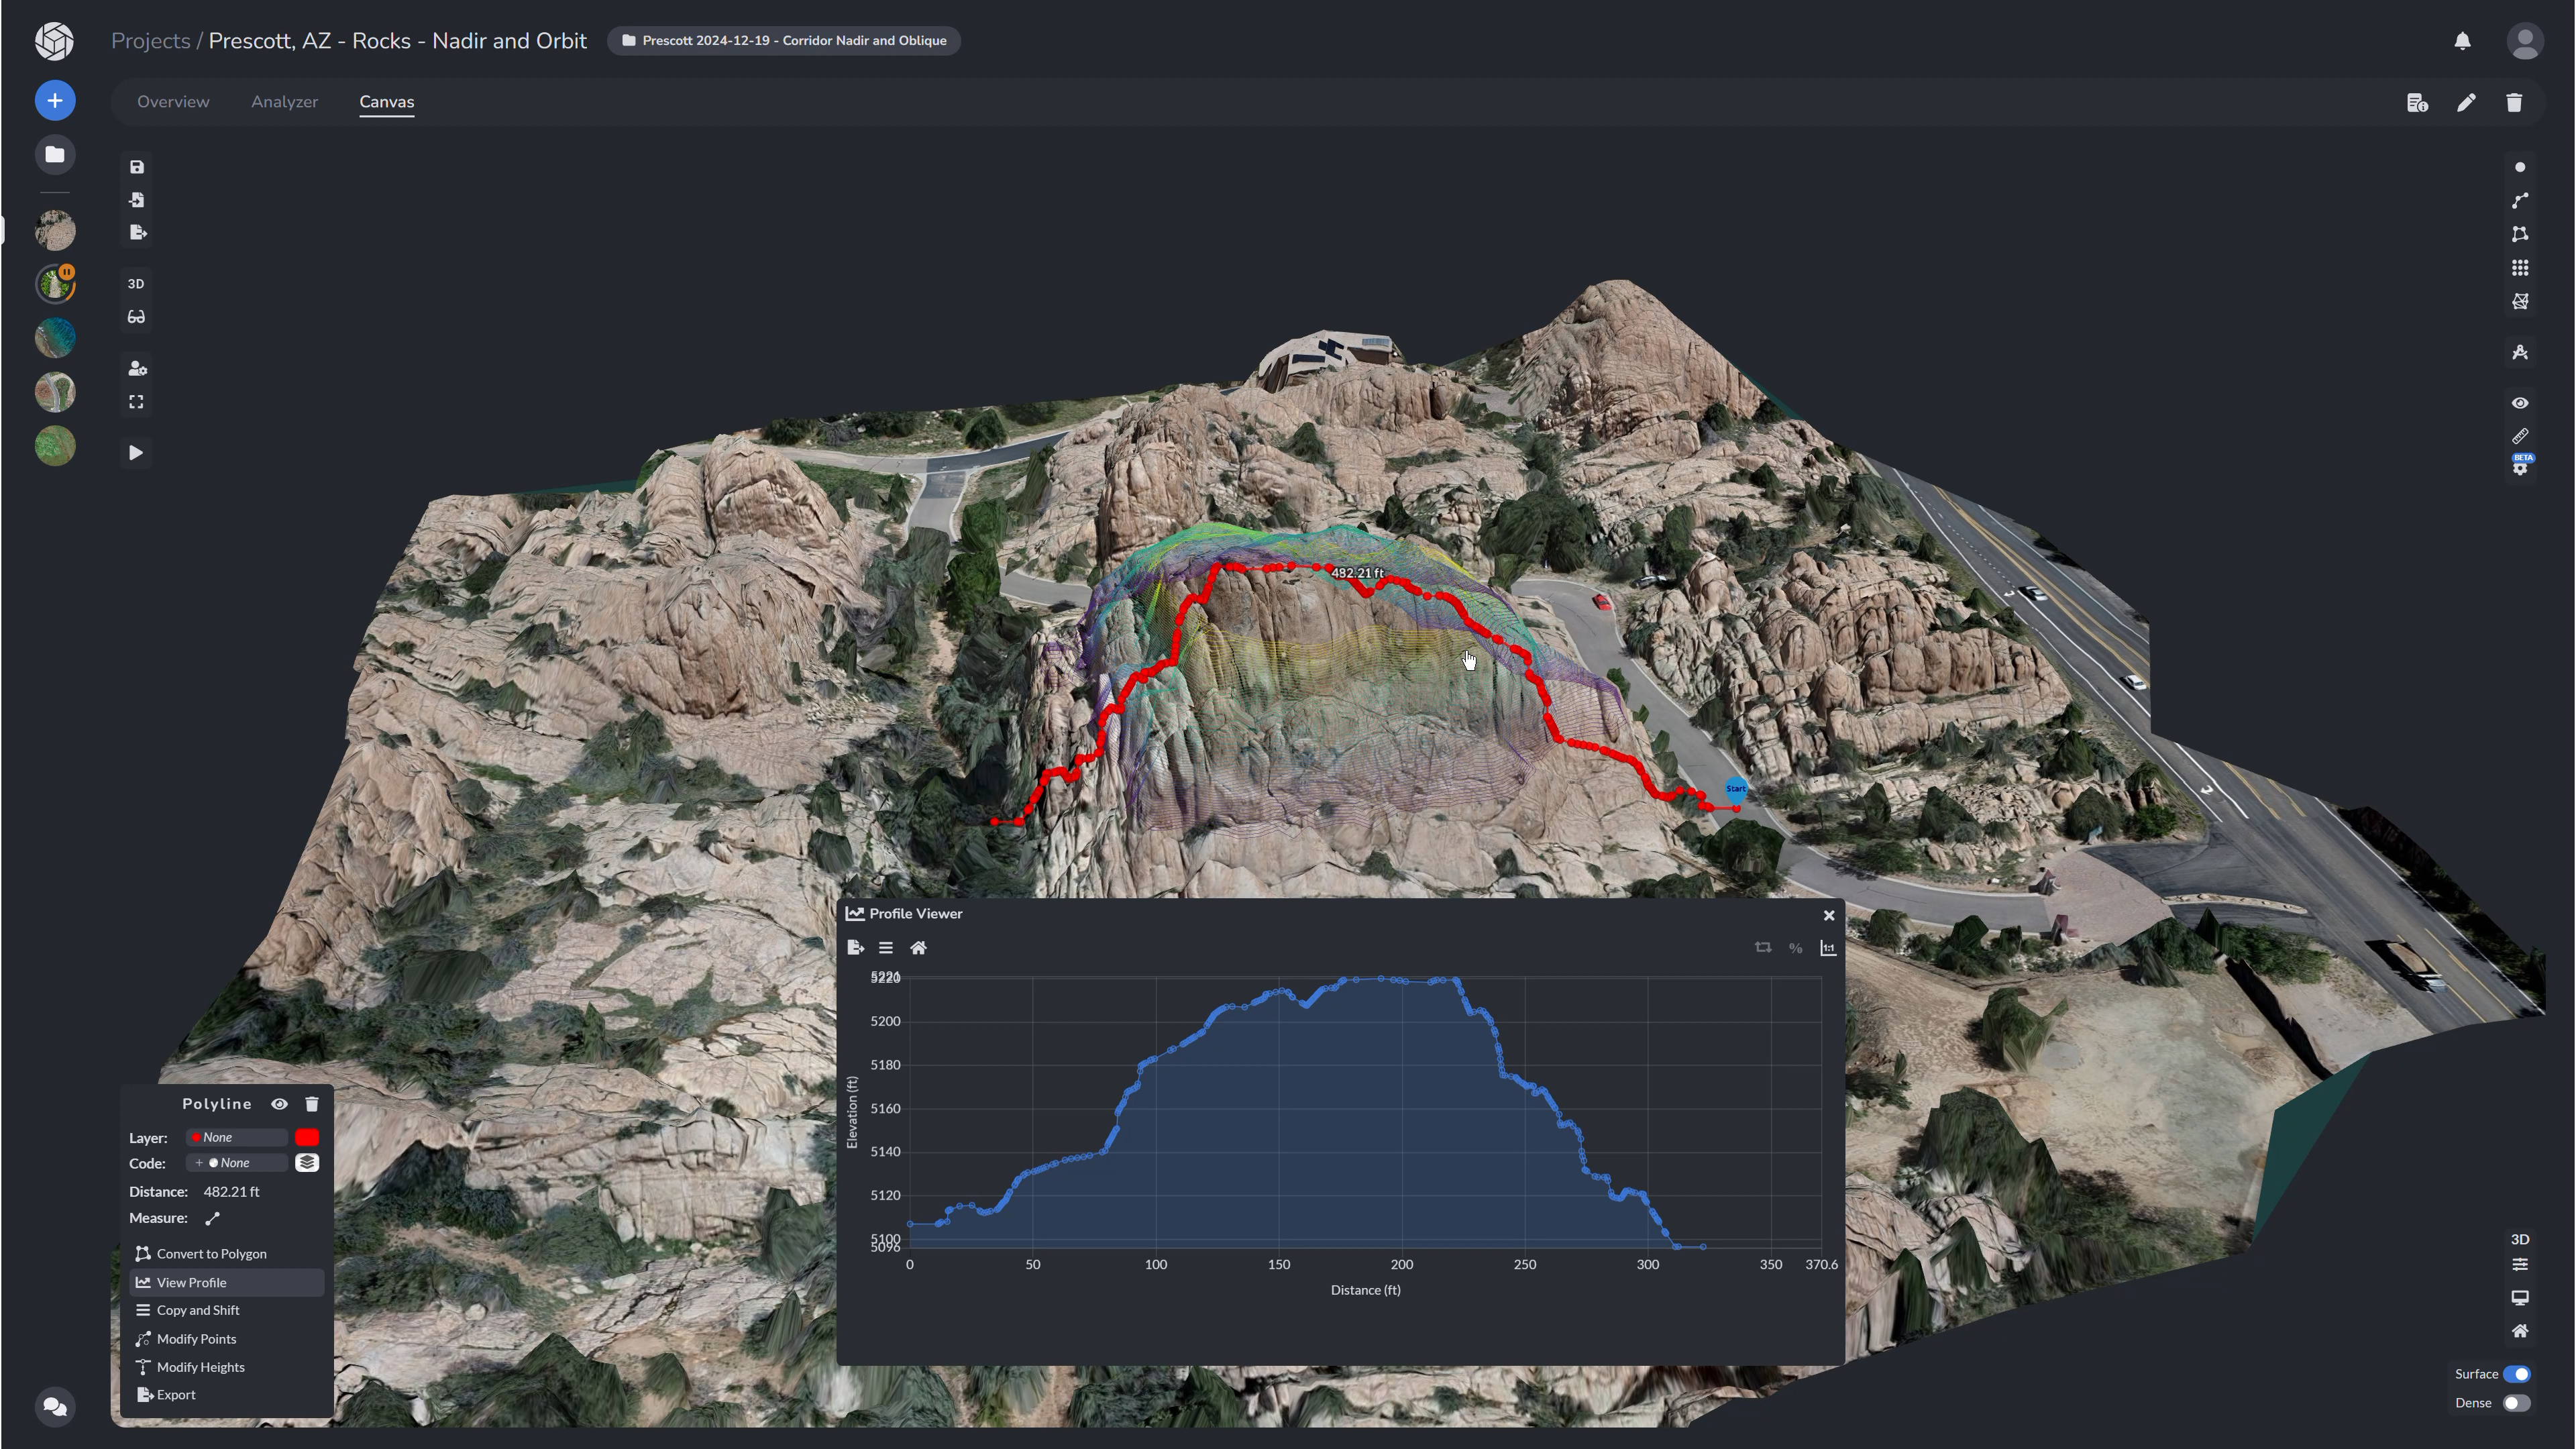
Once processed, your contour lines will appear to the specifications you set. Looking at the profile of the terrain in this dataset, we can see that the elevation changes from about 5,110 feet up to a max of 5,300 feet. In this example we have set the Z MAX to 5200 feet and the Z MIN to 5140 feet - so we essentially are cutting off a little bit of the bottom and the top in our final contour layer. Upon processing, the image pictured below is our final result (below).

-
Set the Contour Size Minimum Line which defines the minimum length of individual contour lines to include. Increasing this value filters out small, short contours — like minor surface bumps — helping to reduce visual clutter in your final output.
-
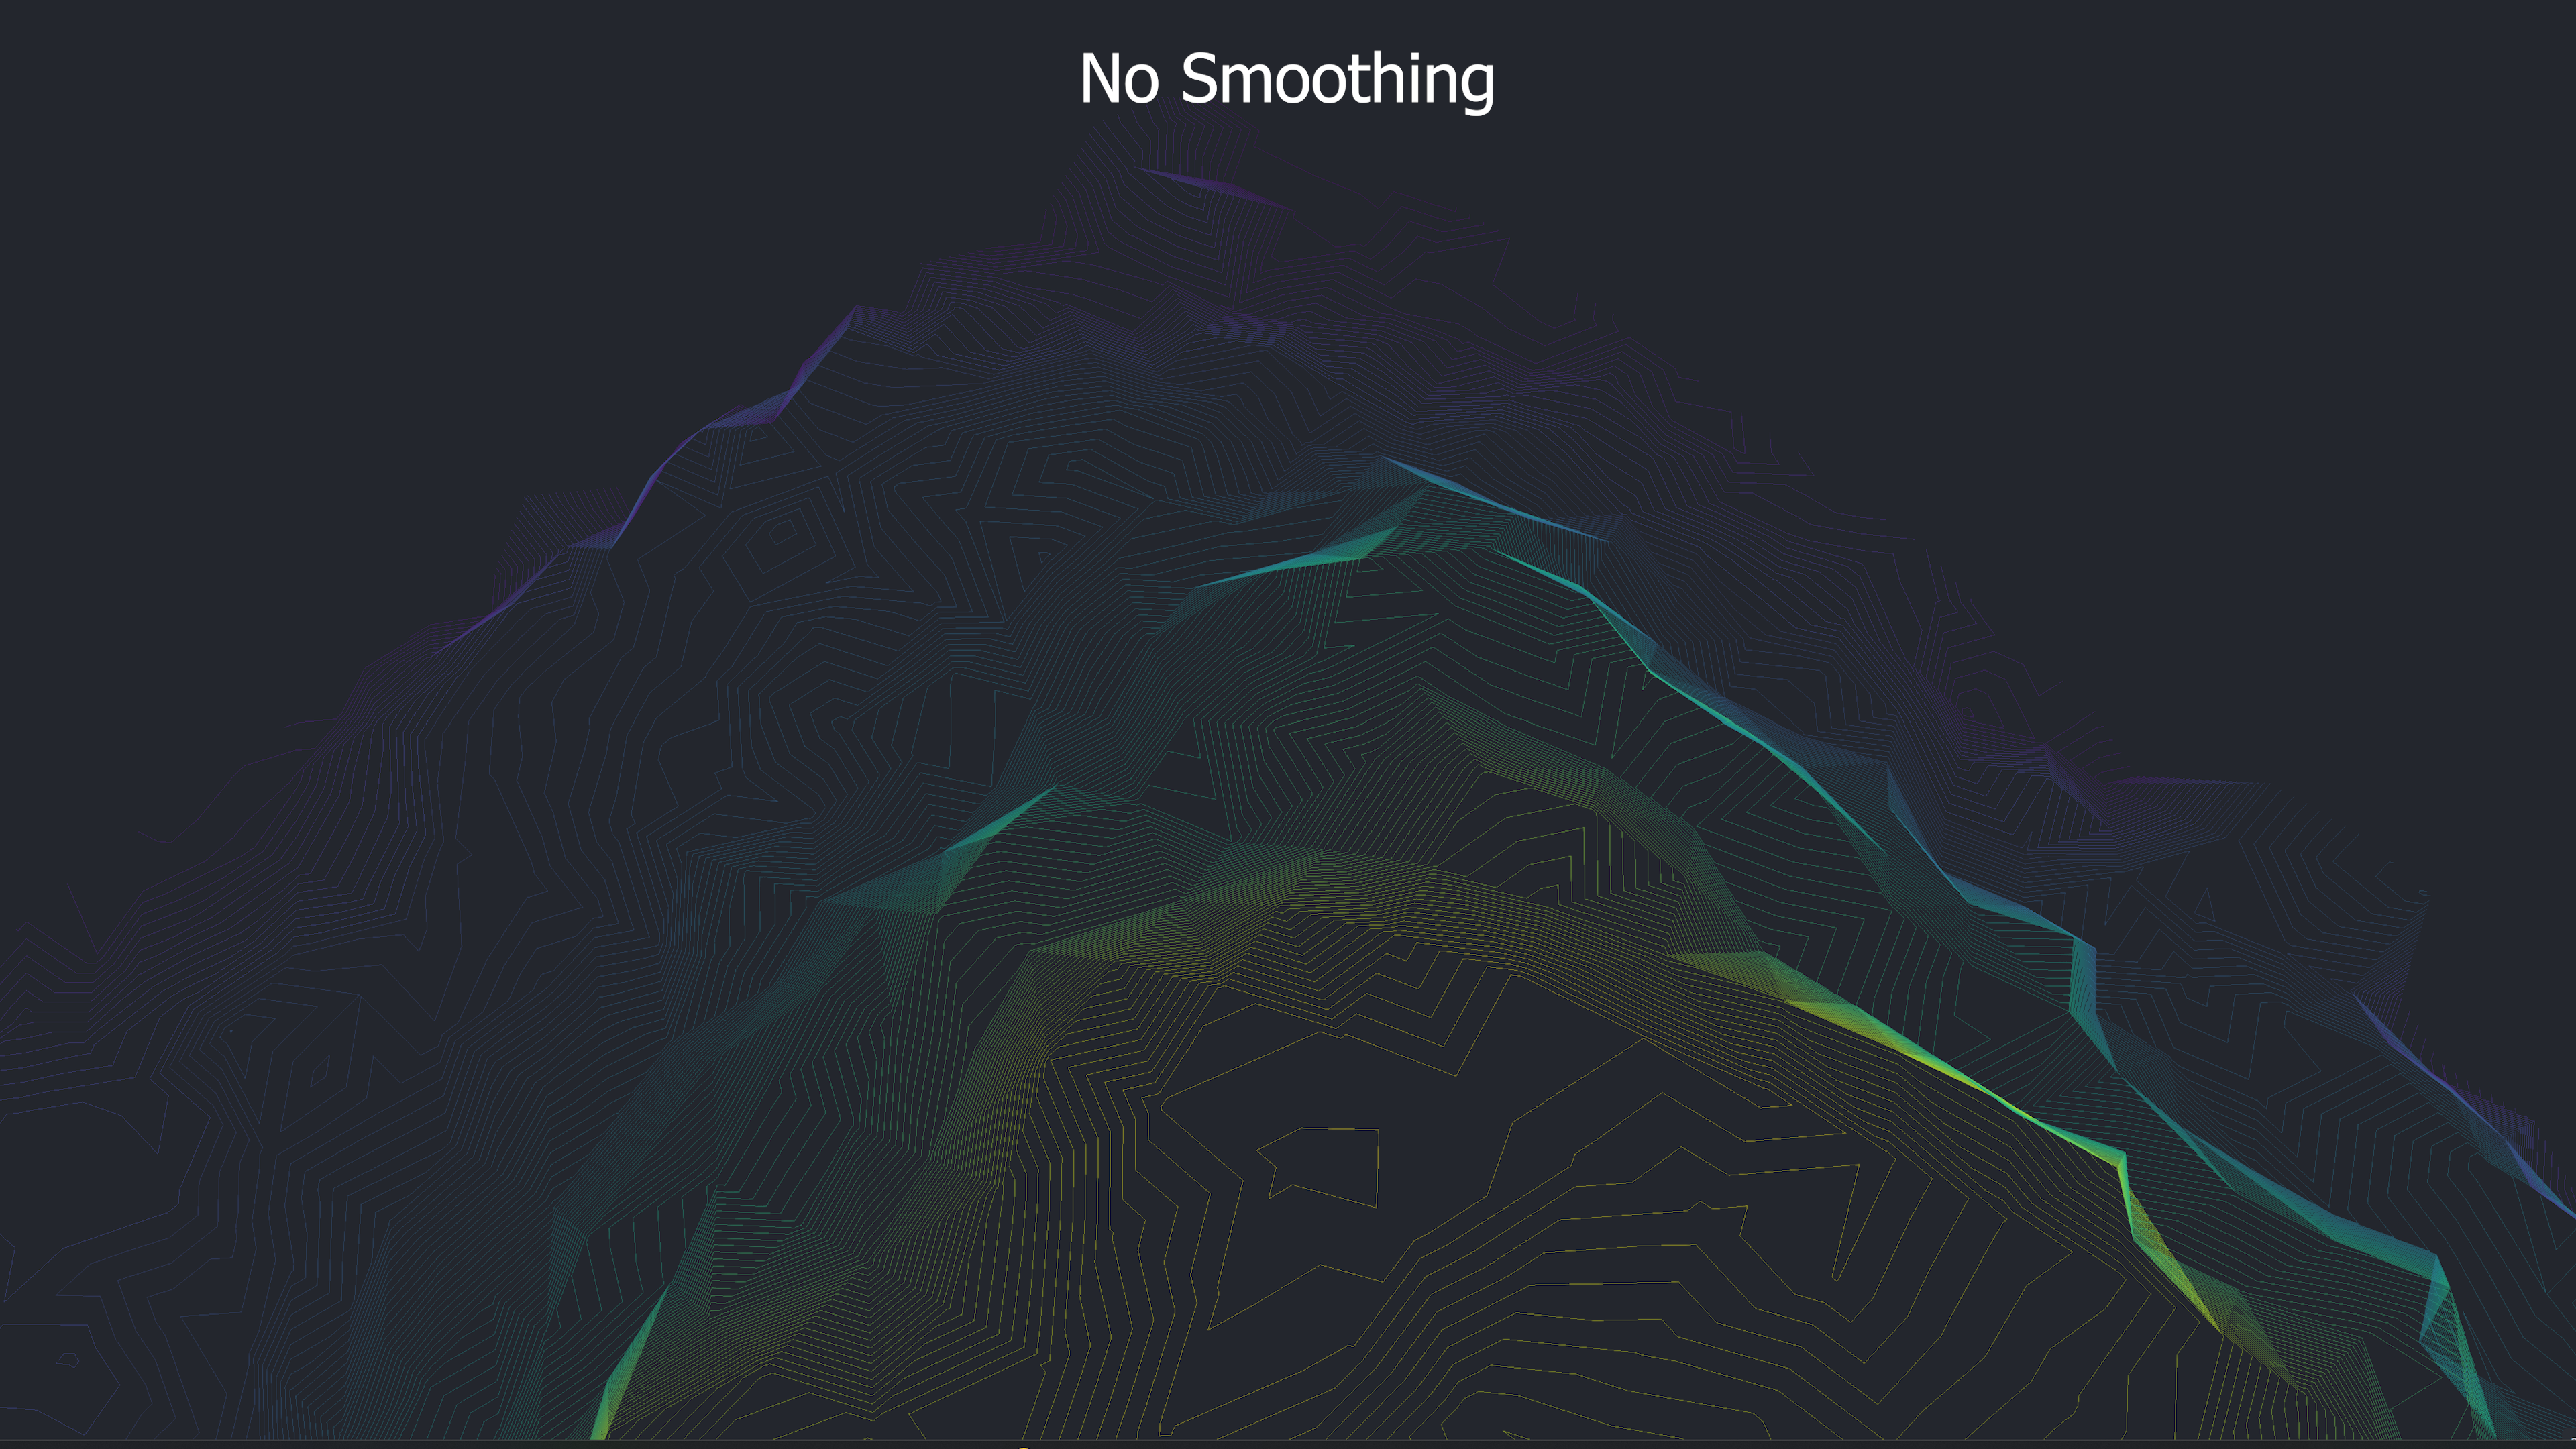
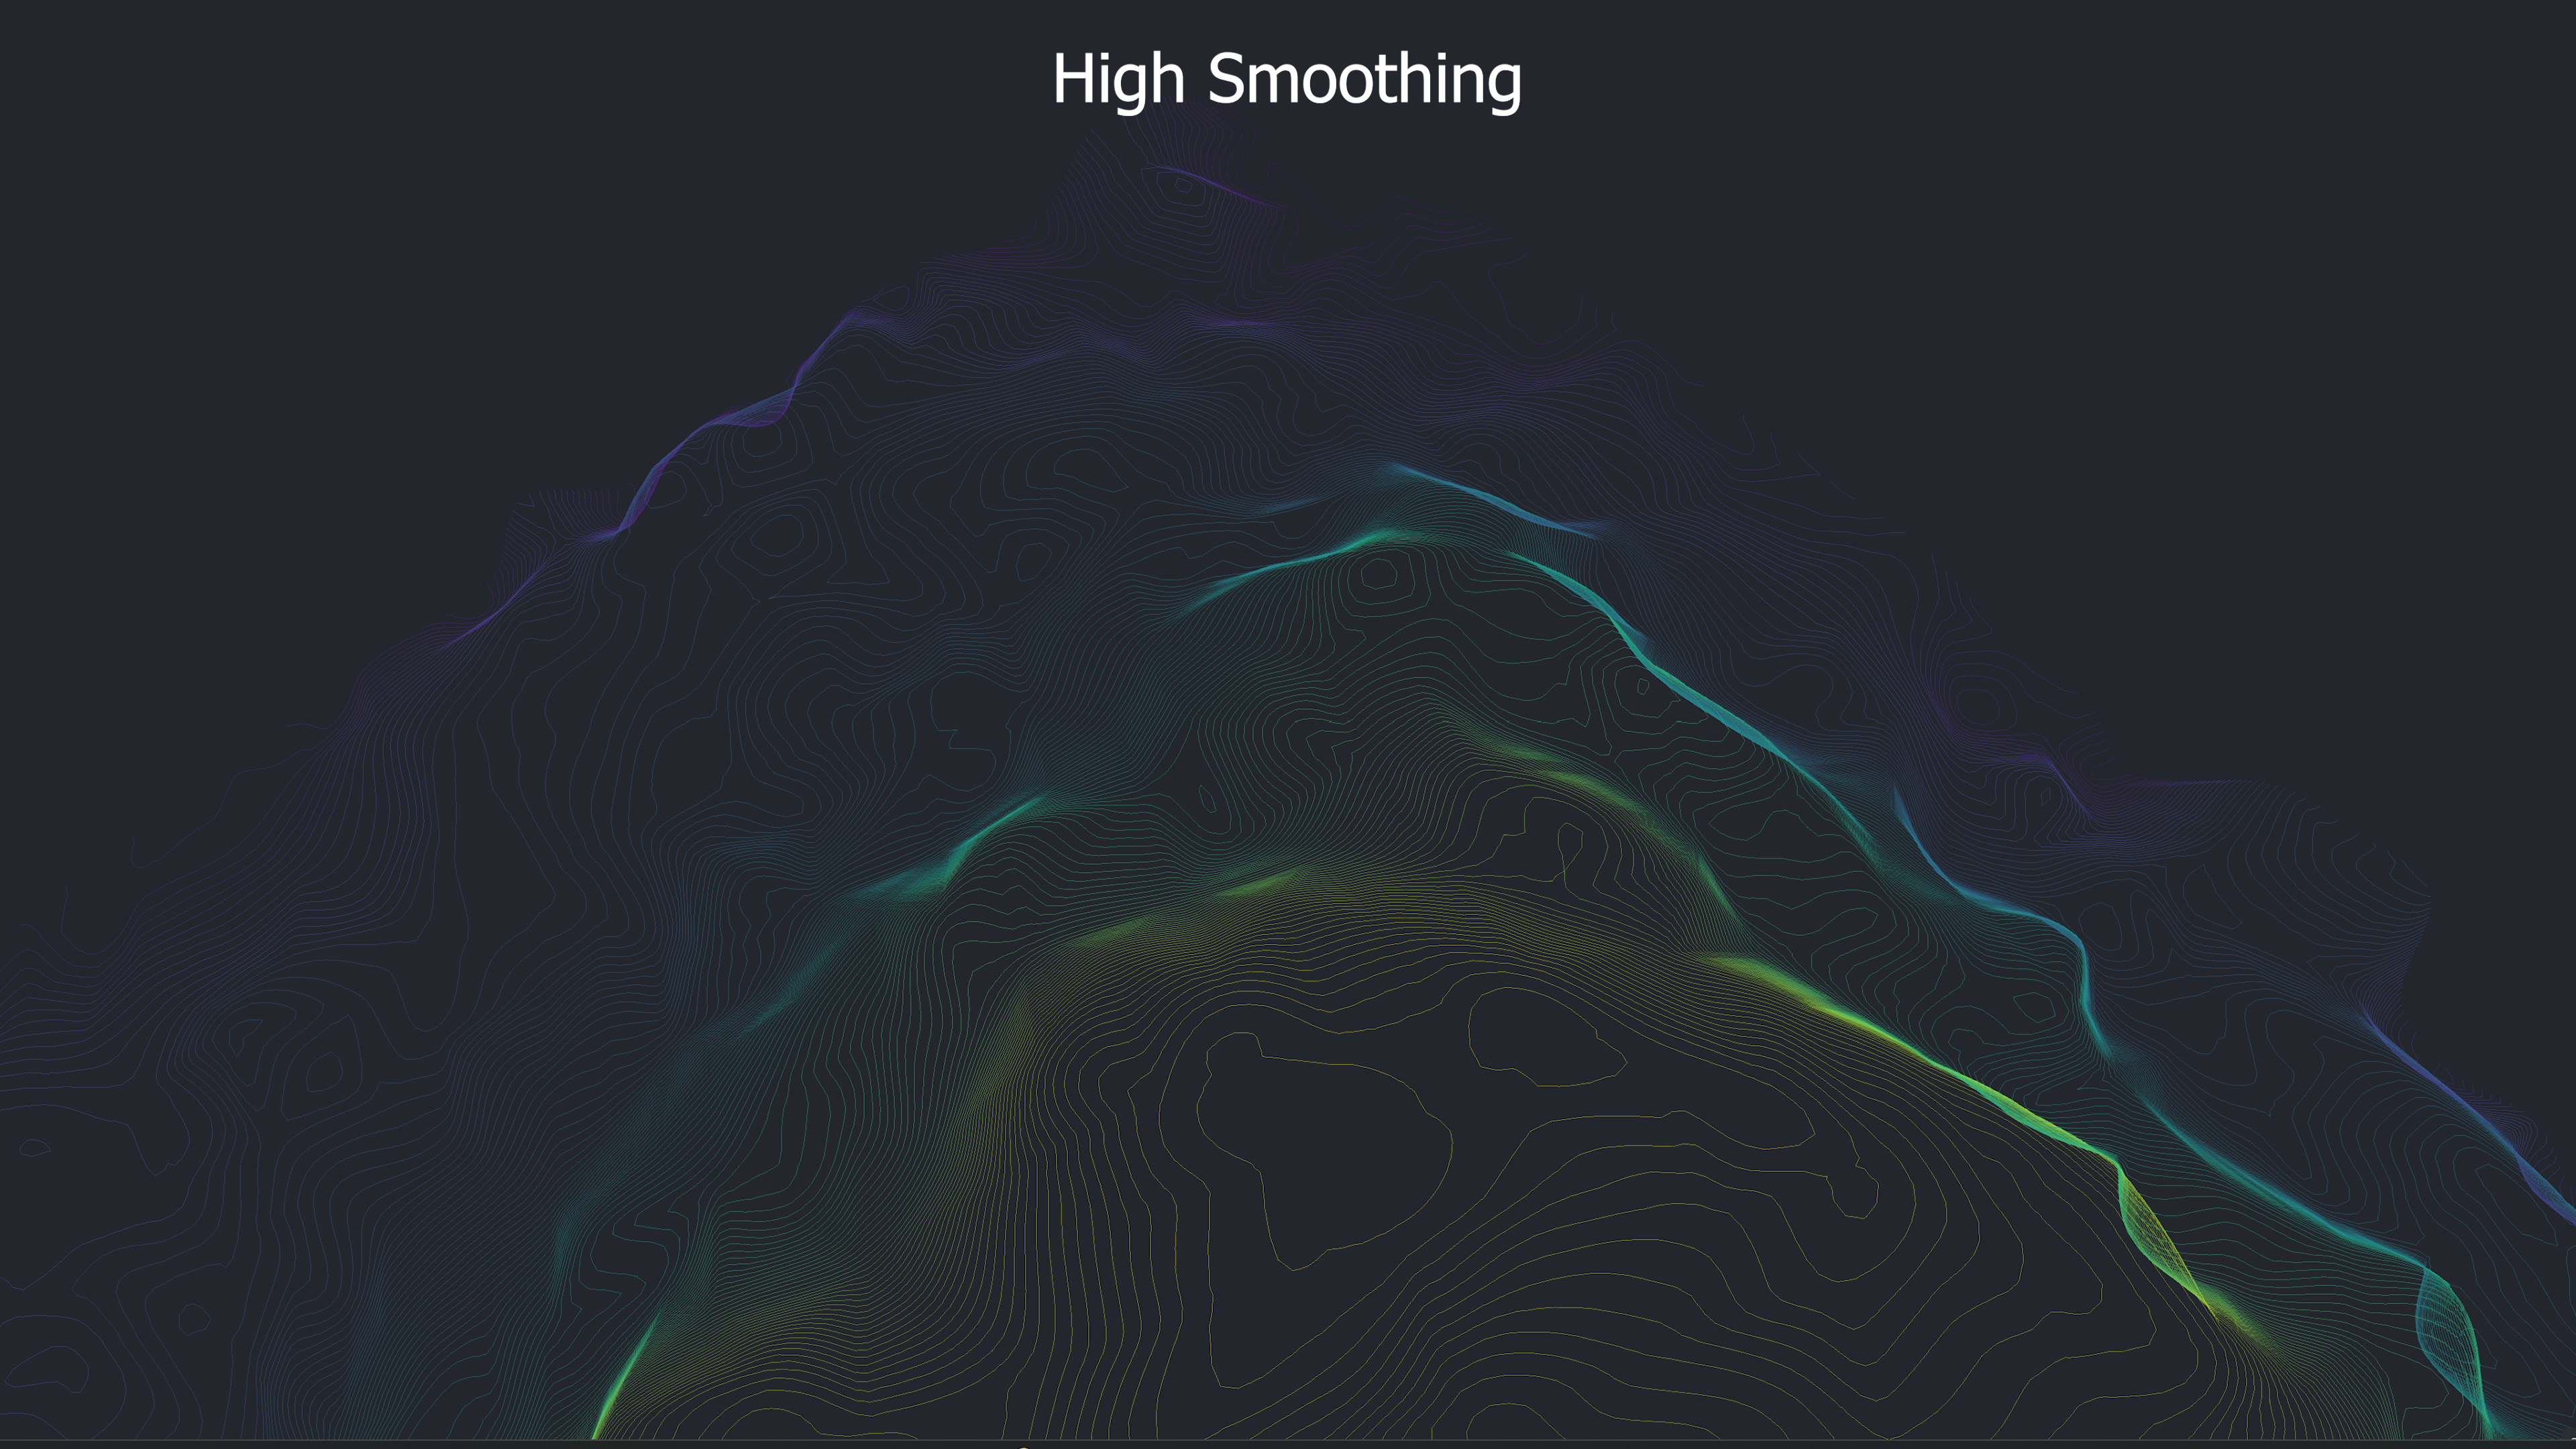
Select the Contour Smoothing Factor (Smoothing) which sets the smoothing level of the contour lines. This example shows the topographic lines with No smoothing and High Smoothing. By comparing the two, the no smoothing model has much squarer geometry while the high smoothing has much more rounded features.
-
Toggle Trim Edges, intelligently trims away components of contour lines that make contact with the border of the TIN.
-
Toggle Index Lines which are displayed in bold and are annotated with an elevation measurement in the scene - as well as set the frequency of the Contour Index measurements for every how ever many lines you would like it to appear on.
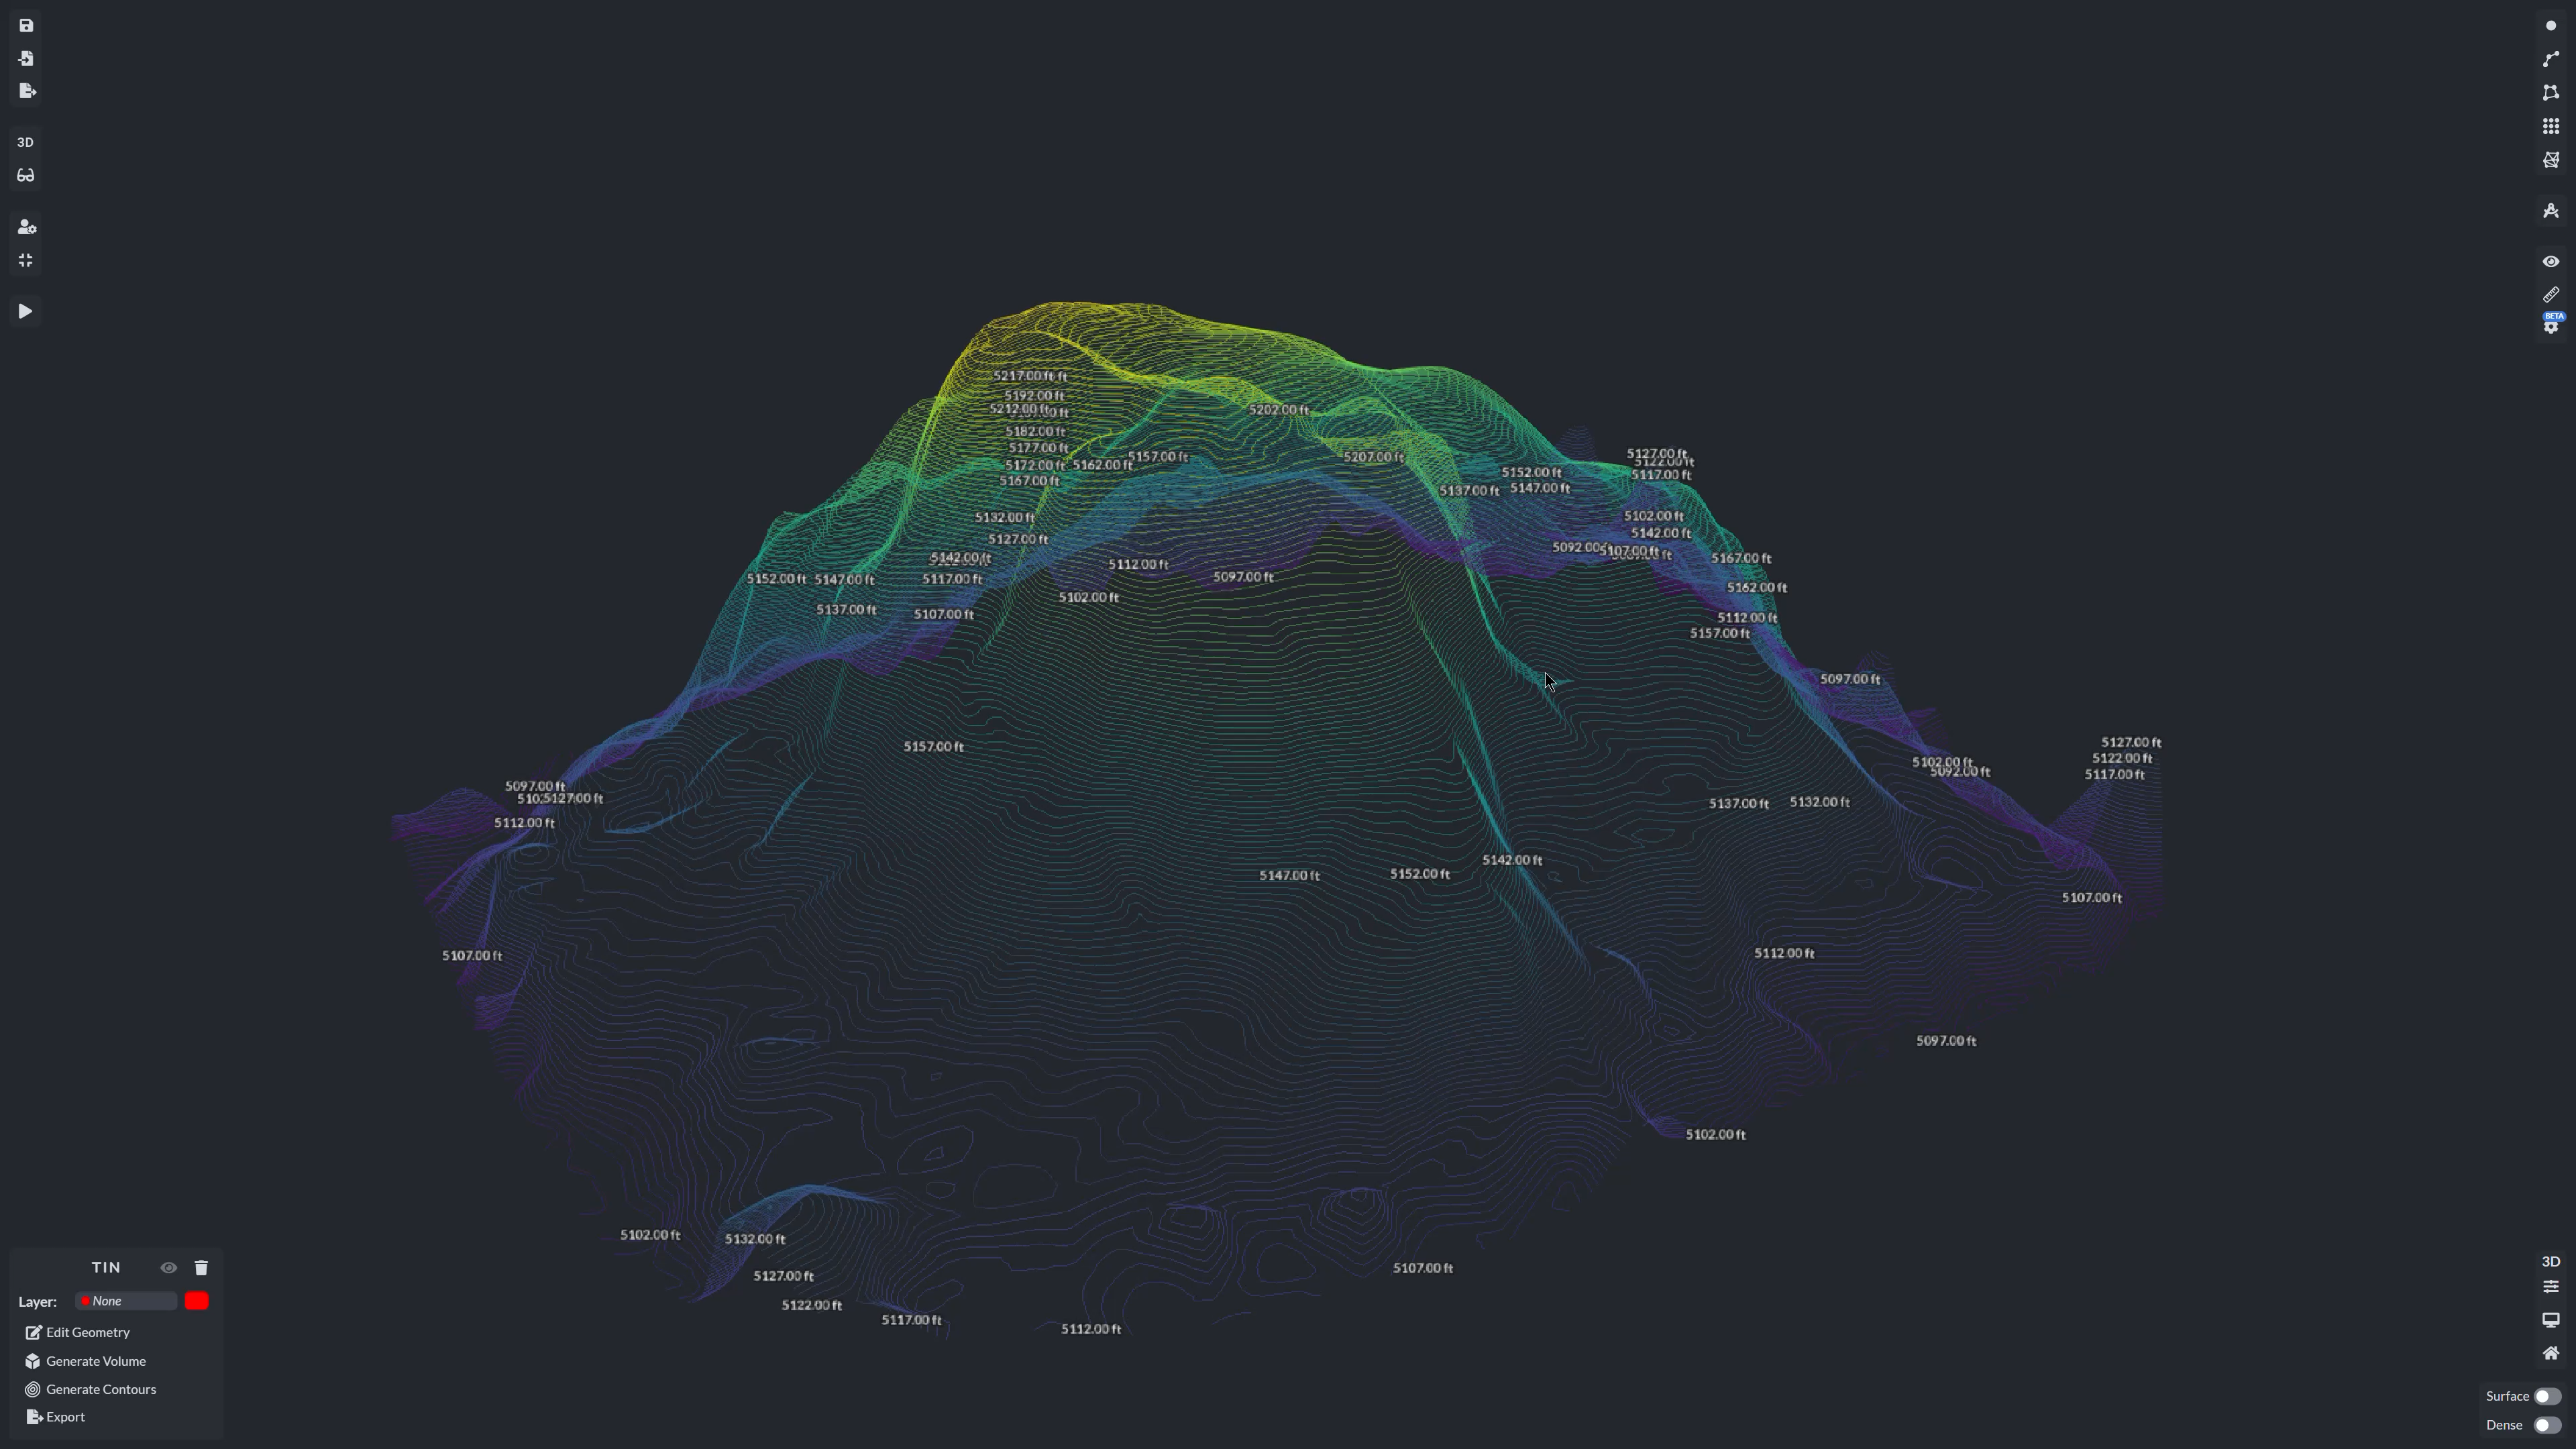
Upon hitting Generate Contours your contours will be created.

The generated contour lines provide a precise elevation map, which is essential for site planning, land development, and hydrological analysis. Depending on the surface of your map, the contour lines may be difficult to see. To see the contours more clearly, you can toggle off the Surface Model or Dense Point Cloud, respectively.
Exporting Contour Data

After generating contours, the data can be exported in DXF or SHP file formats. These formats are widely compatible with CAD and GIS platforms, allowing seamless integration into various workflows for further analysis, design, or planning.
By utilizing the contour generation tool, you can efficiently visualize and analyze terrain variations, aiding in more informed decision-making for your projects. Whether you’re working in surveying, construction, or environmental monitoring, accurately generated contour lines can help mitigate risks, optimize grading plans, and enhance overall project efficiency.
With PixElement’s intuitive workflow, users can efficiently create, refine, and export contour data in industry-standard formats, ensuring compatibility with CAD and GIS platforms. This process makes it easier to integrate topographic data into your broader project pipeline. Mastering contour generation in PixElement not only enhances your mapping capabilities but also empowers you to extract meaningful insights from elevation models with greater precision and ease.