Using the Canvas Tab
Today we are going to be going over how to use the Canvas tab in PixElement. Please see the video version of this article below:
The Canvas tab is your 3D workspace to annotate and analyze your dataset. We have three toolbars, each with different capabilities, one on the upper left, the upper right, and on the lower right.
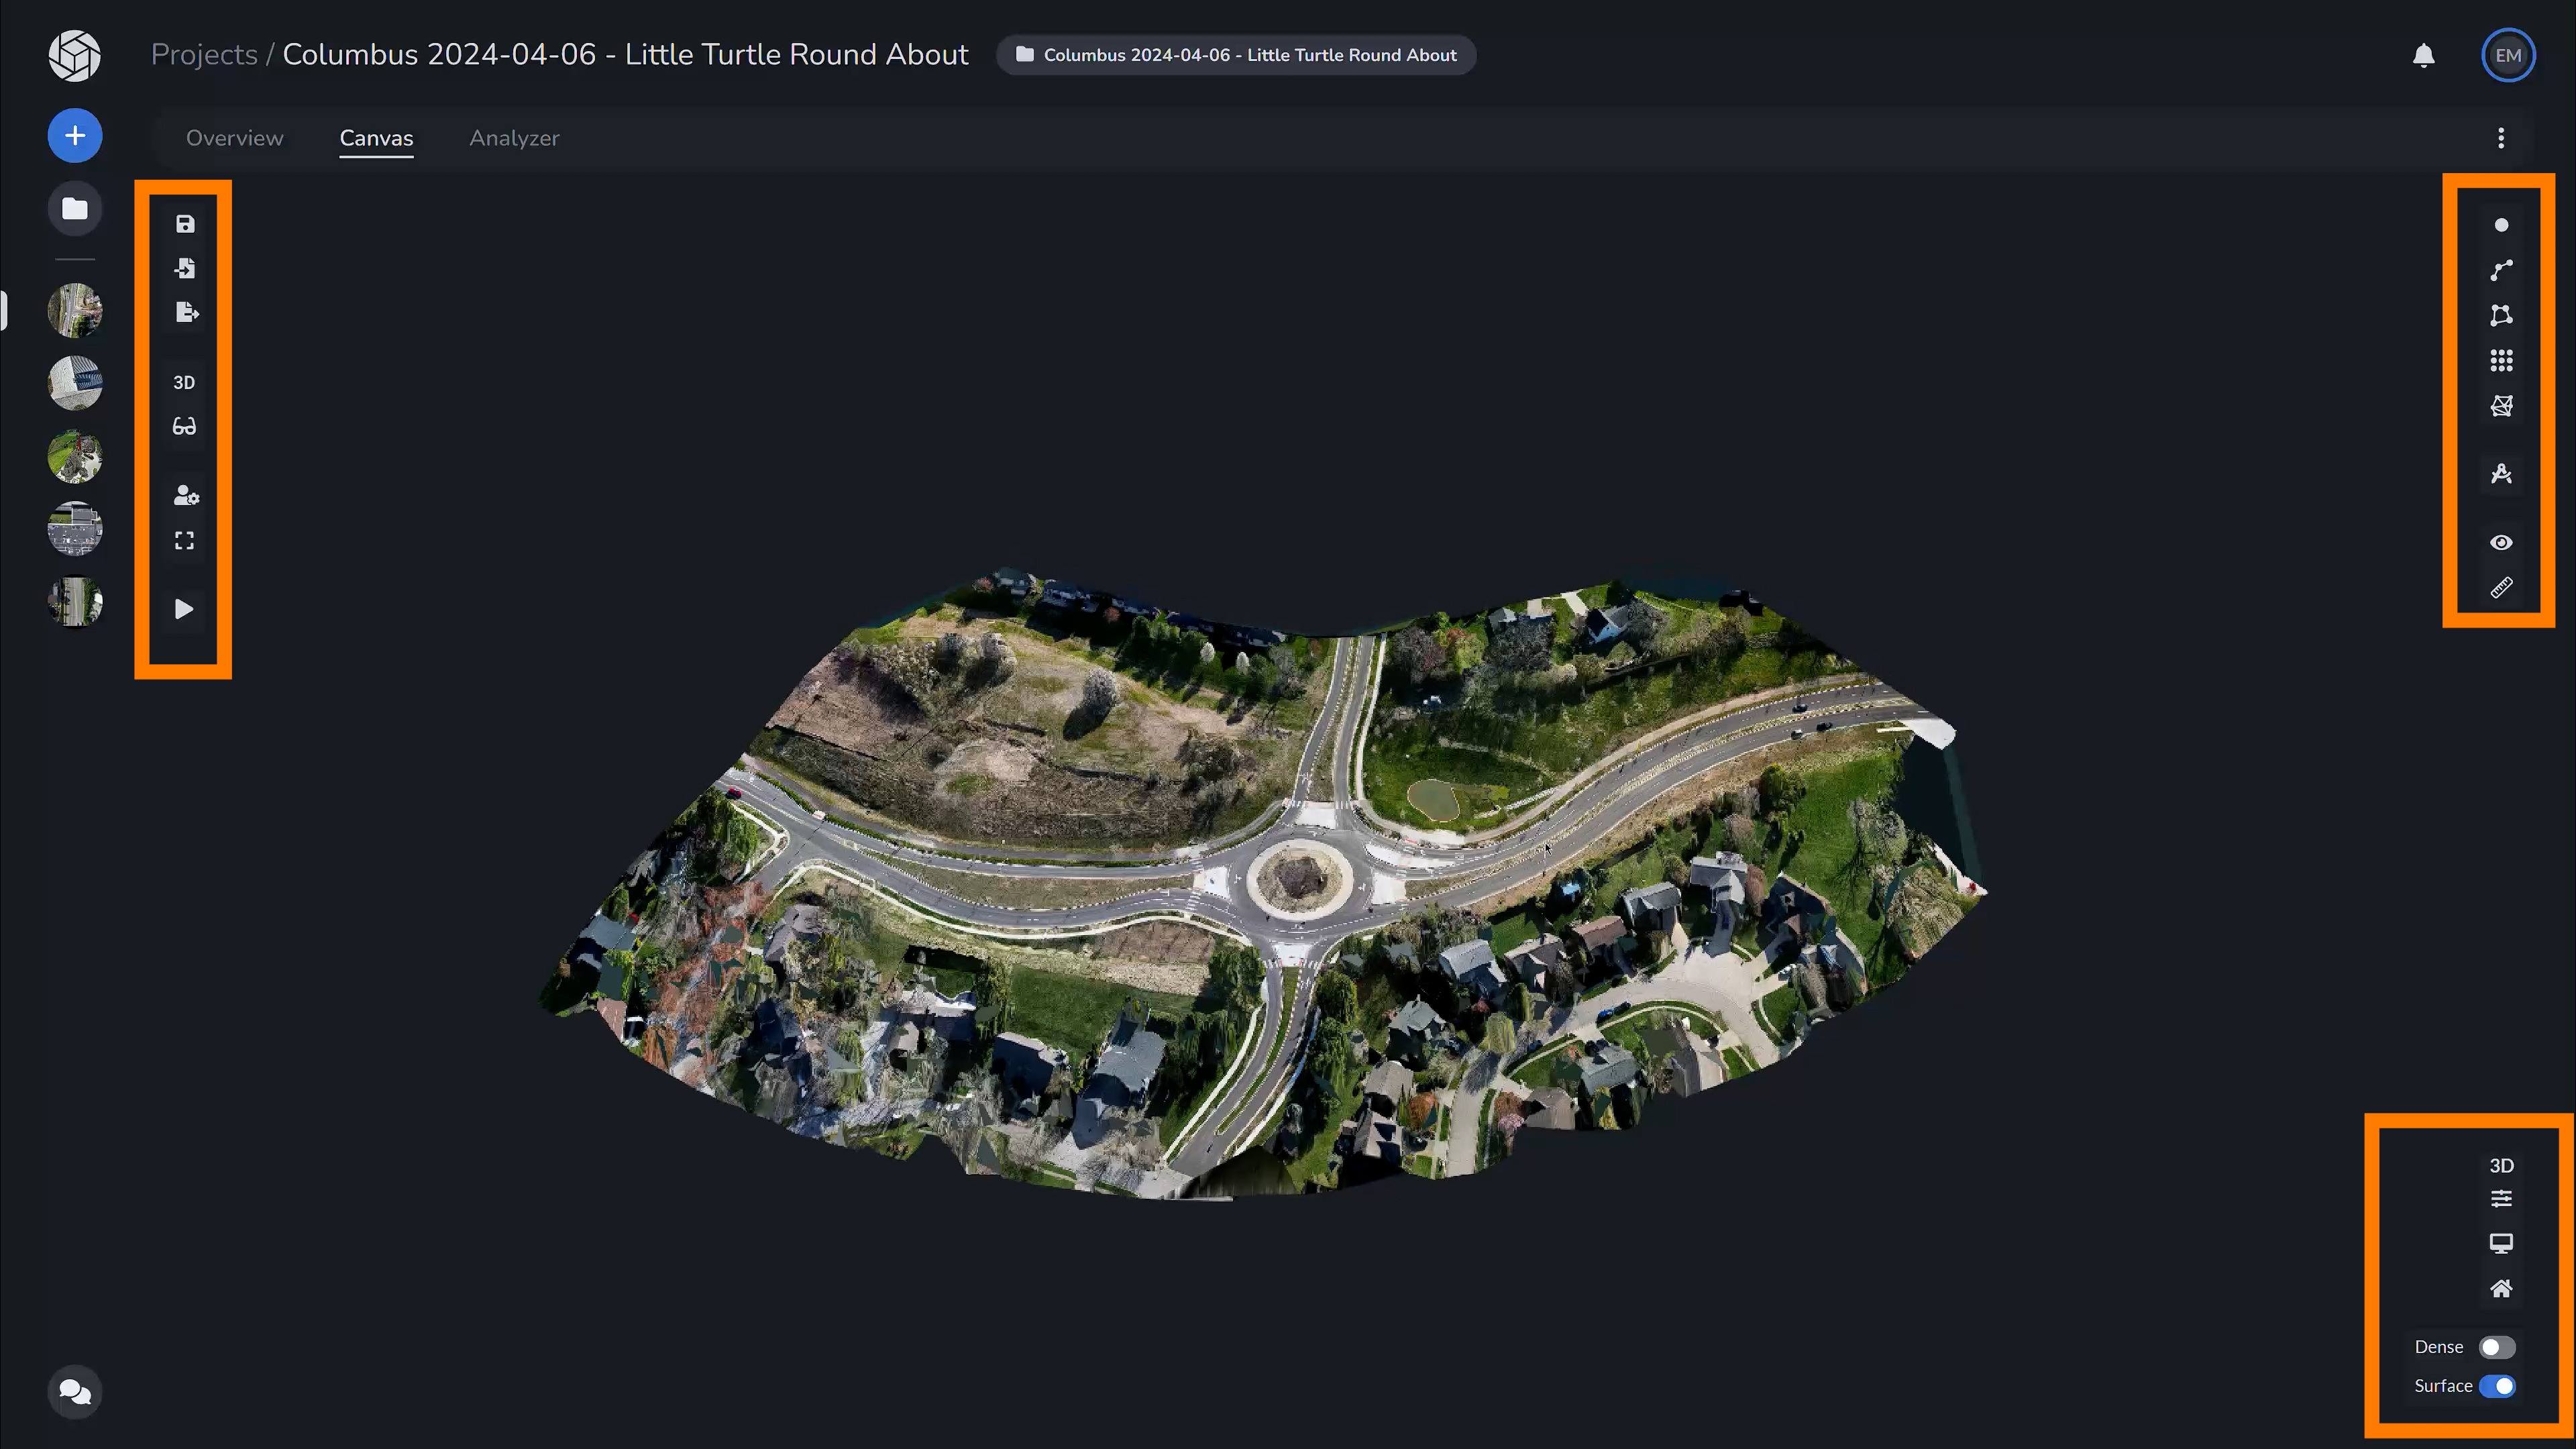
On the left, our options are to save our drawing (of what we annotated in this project), import a drawing (with the respective file names listed), export your drawing that you made in this canvas, toggle whether you would like to view the canvas as 3D, 2D or in 2D classic (which is used primarily for viewing overlays and split view of projects), toggle Stereo Reconstruction (which you would use to reconstruct any 3D feature that is visible in the images - we will go over this in a later video tutorial).
The next tool is additional settings to toggle autosave and hover tooltips, toggle fullscreen, and reprocess your project.
On the top right are the annotation tools. These are the “workhorses” of the survey canvas. They give you the ability to easily digitize directly on the model, in both 2D and/or 3D.
On the bottom right are more view and reposition options.

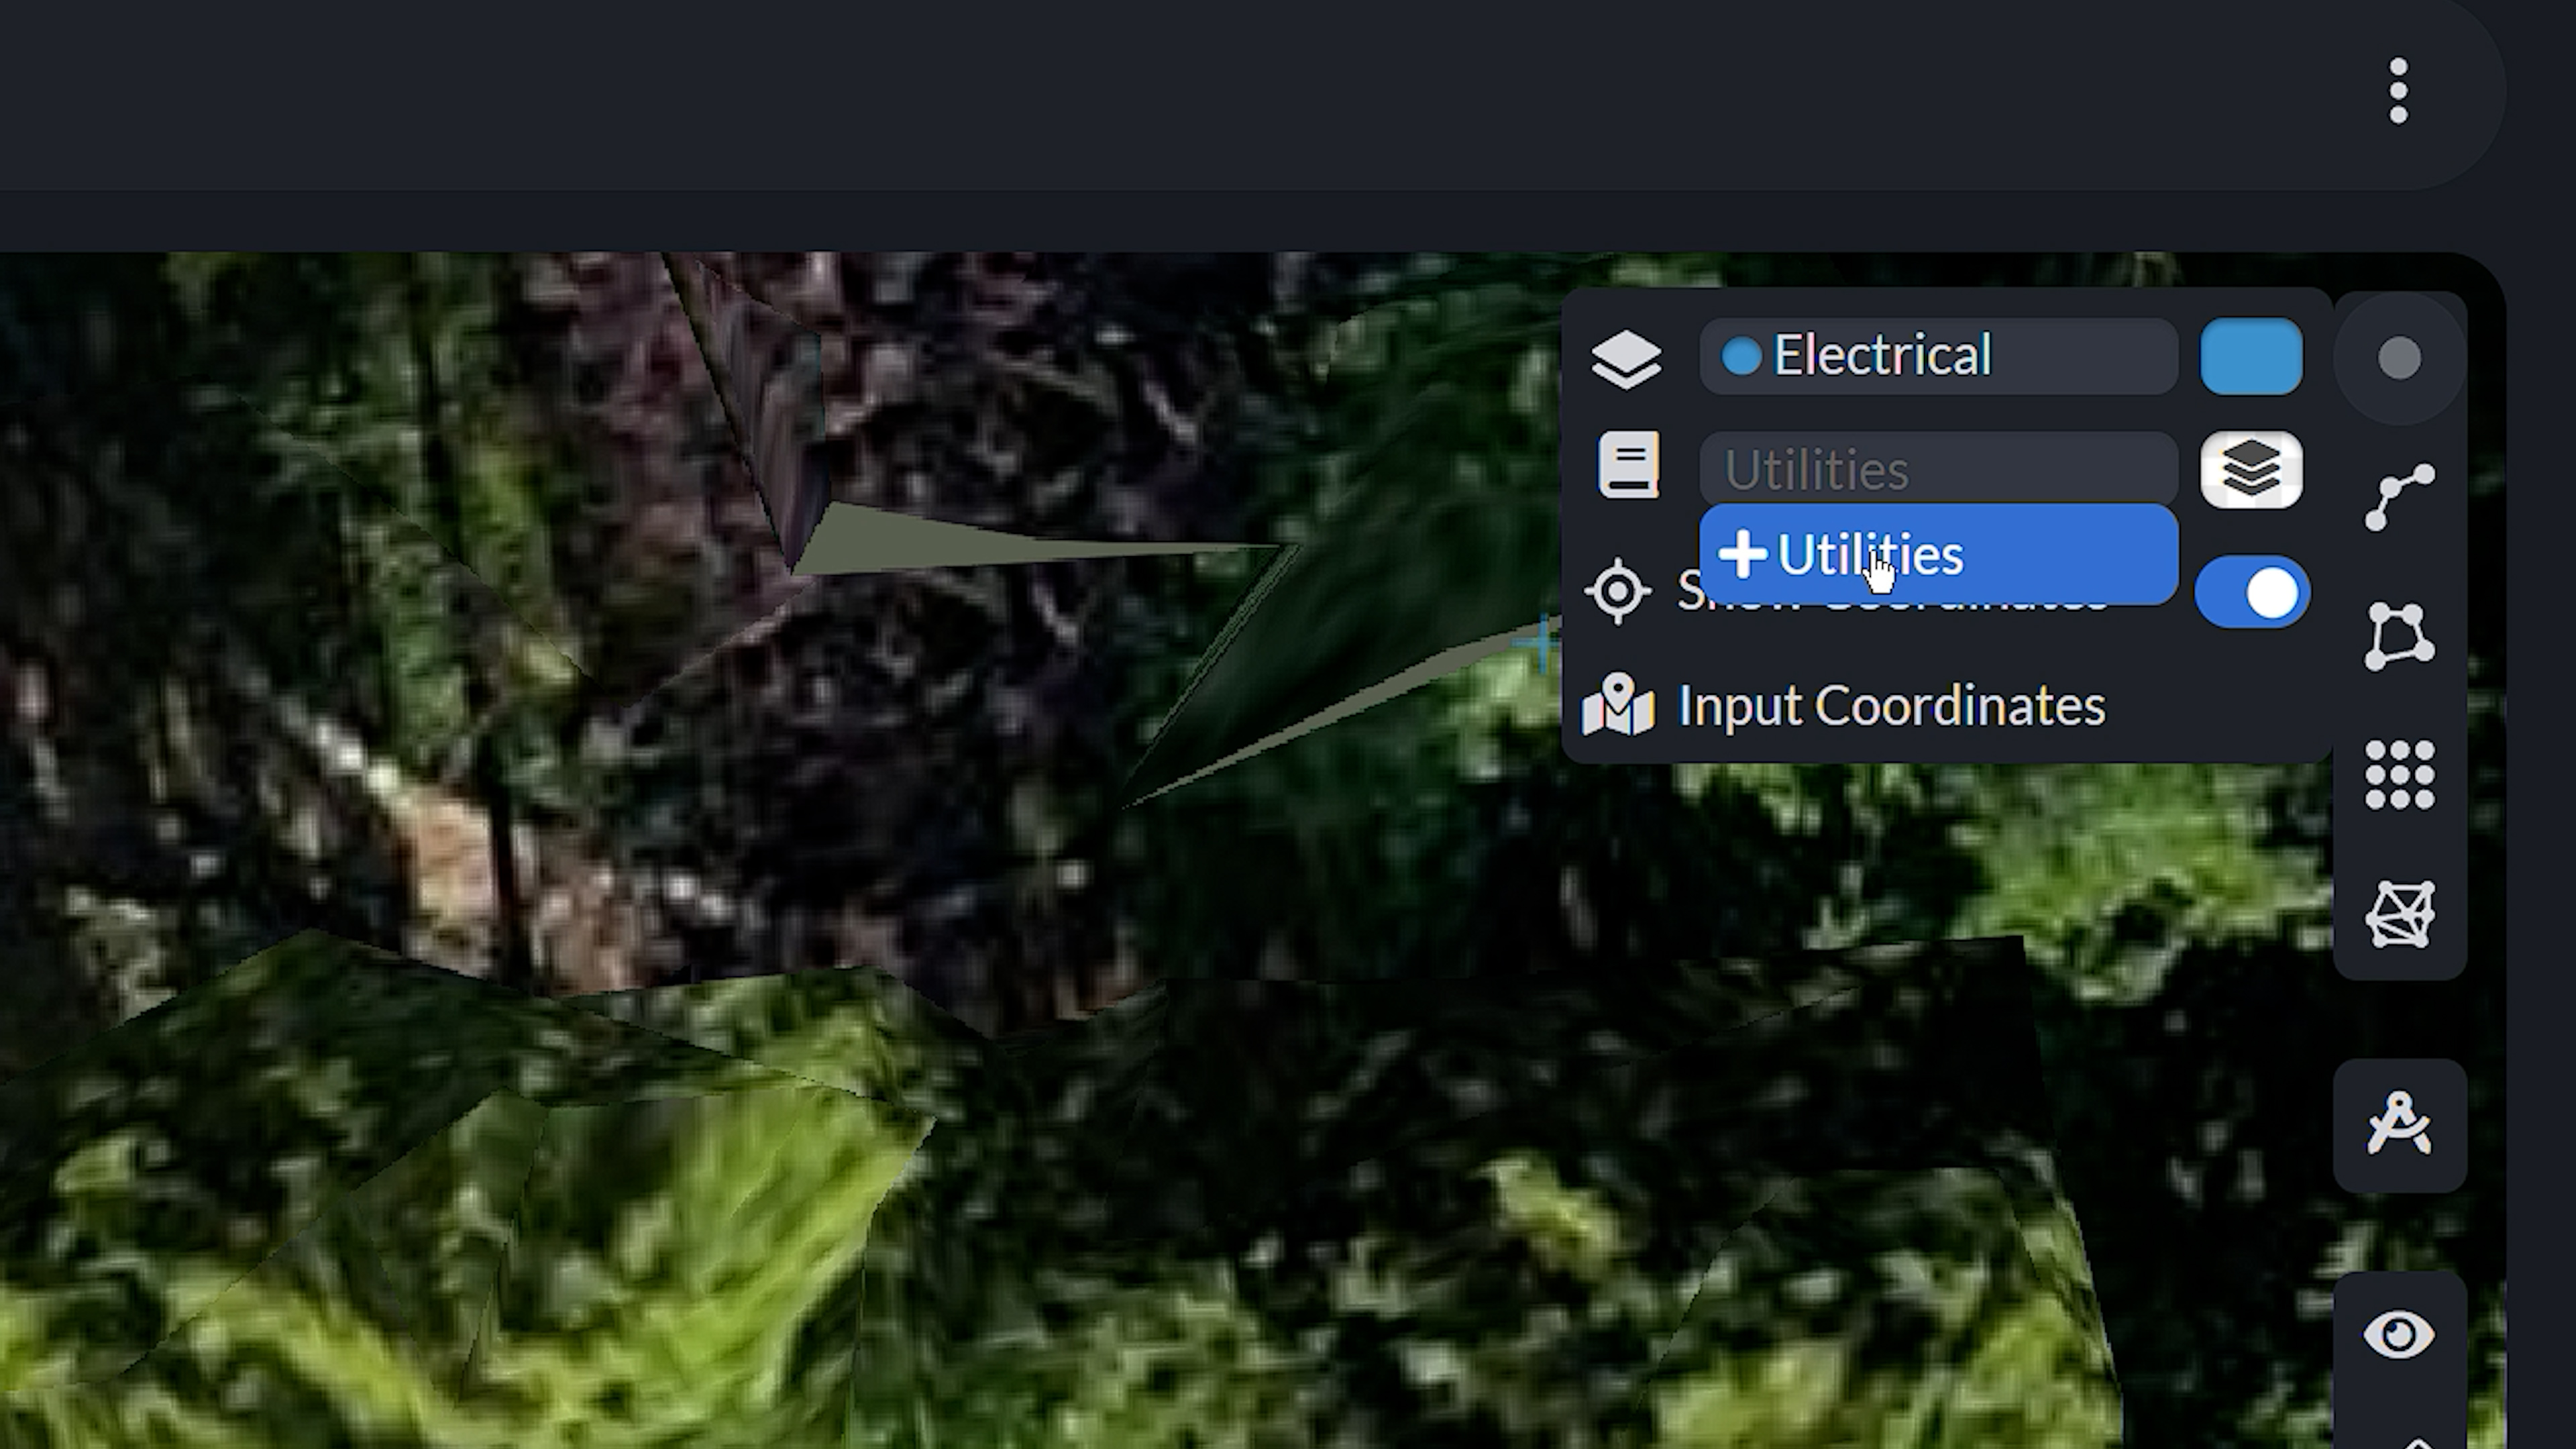
To add a Point, select the point tool. In the menu you are able to create a layer and choose its respective color, as well as create a feature code picker layer if you need to do so for your project. If you have the exact coordinates for the point, you may select “Input Coordinates”, and enter the coordinates. If your coordinates are in a different unit, you may change the unit by selecting the “Unit” tool. This feature would be useful for traversing, for example.
Once you create a point, a menu will appear on the bottom left hand side and will show you its coordinates, you can toggle the measure pinpoint to show and hide this.
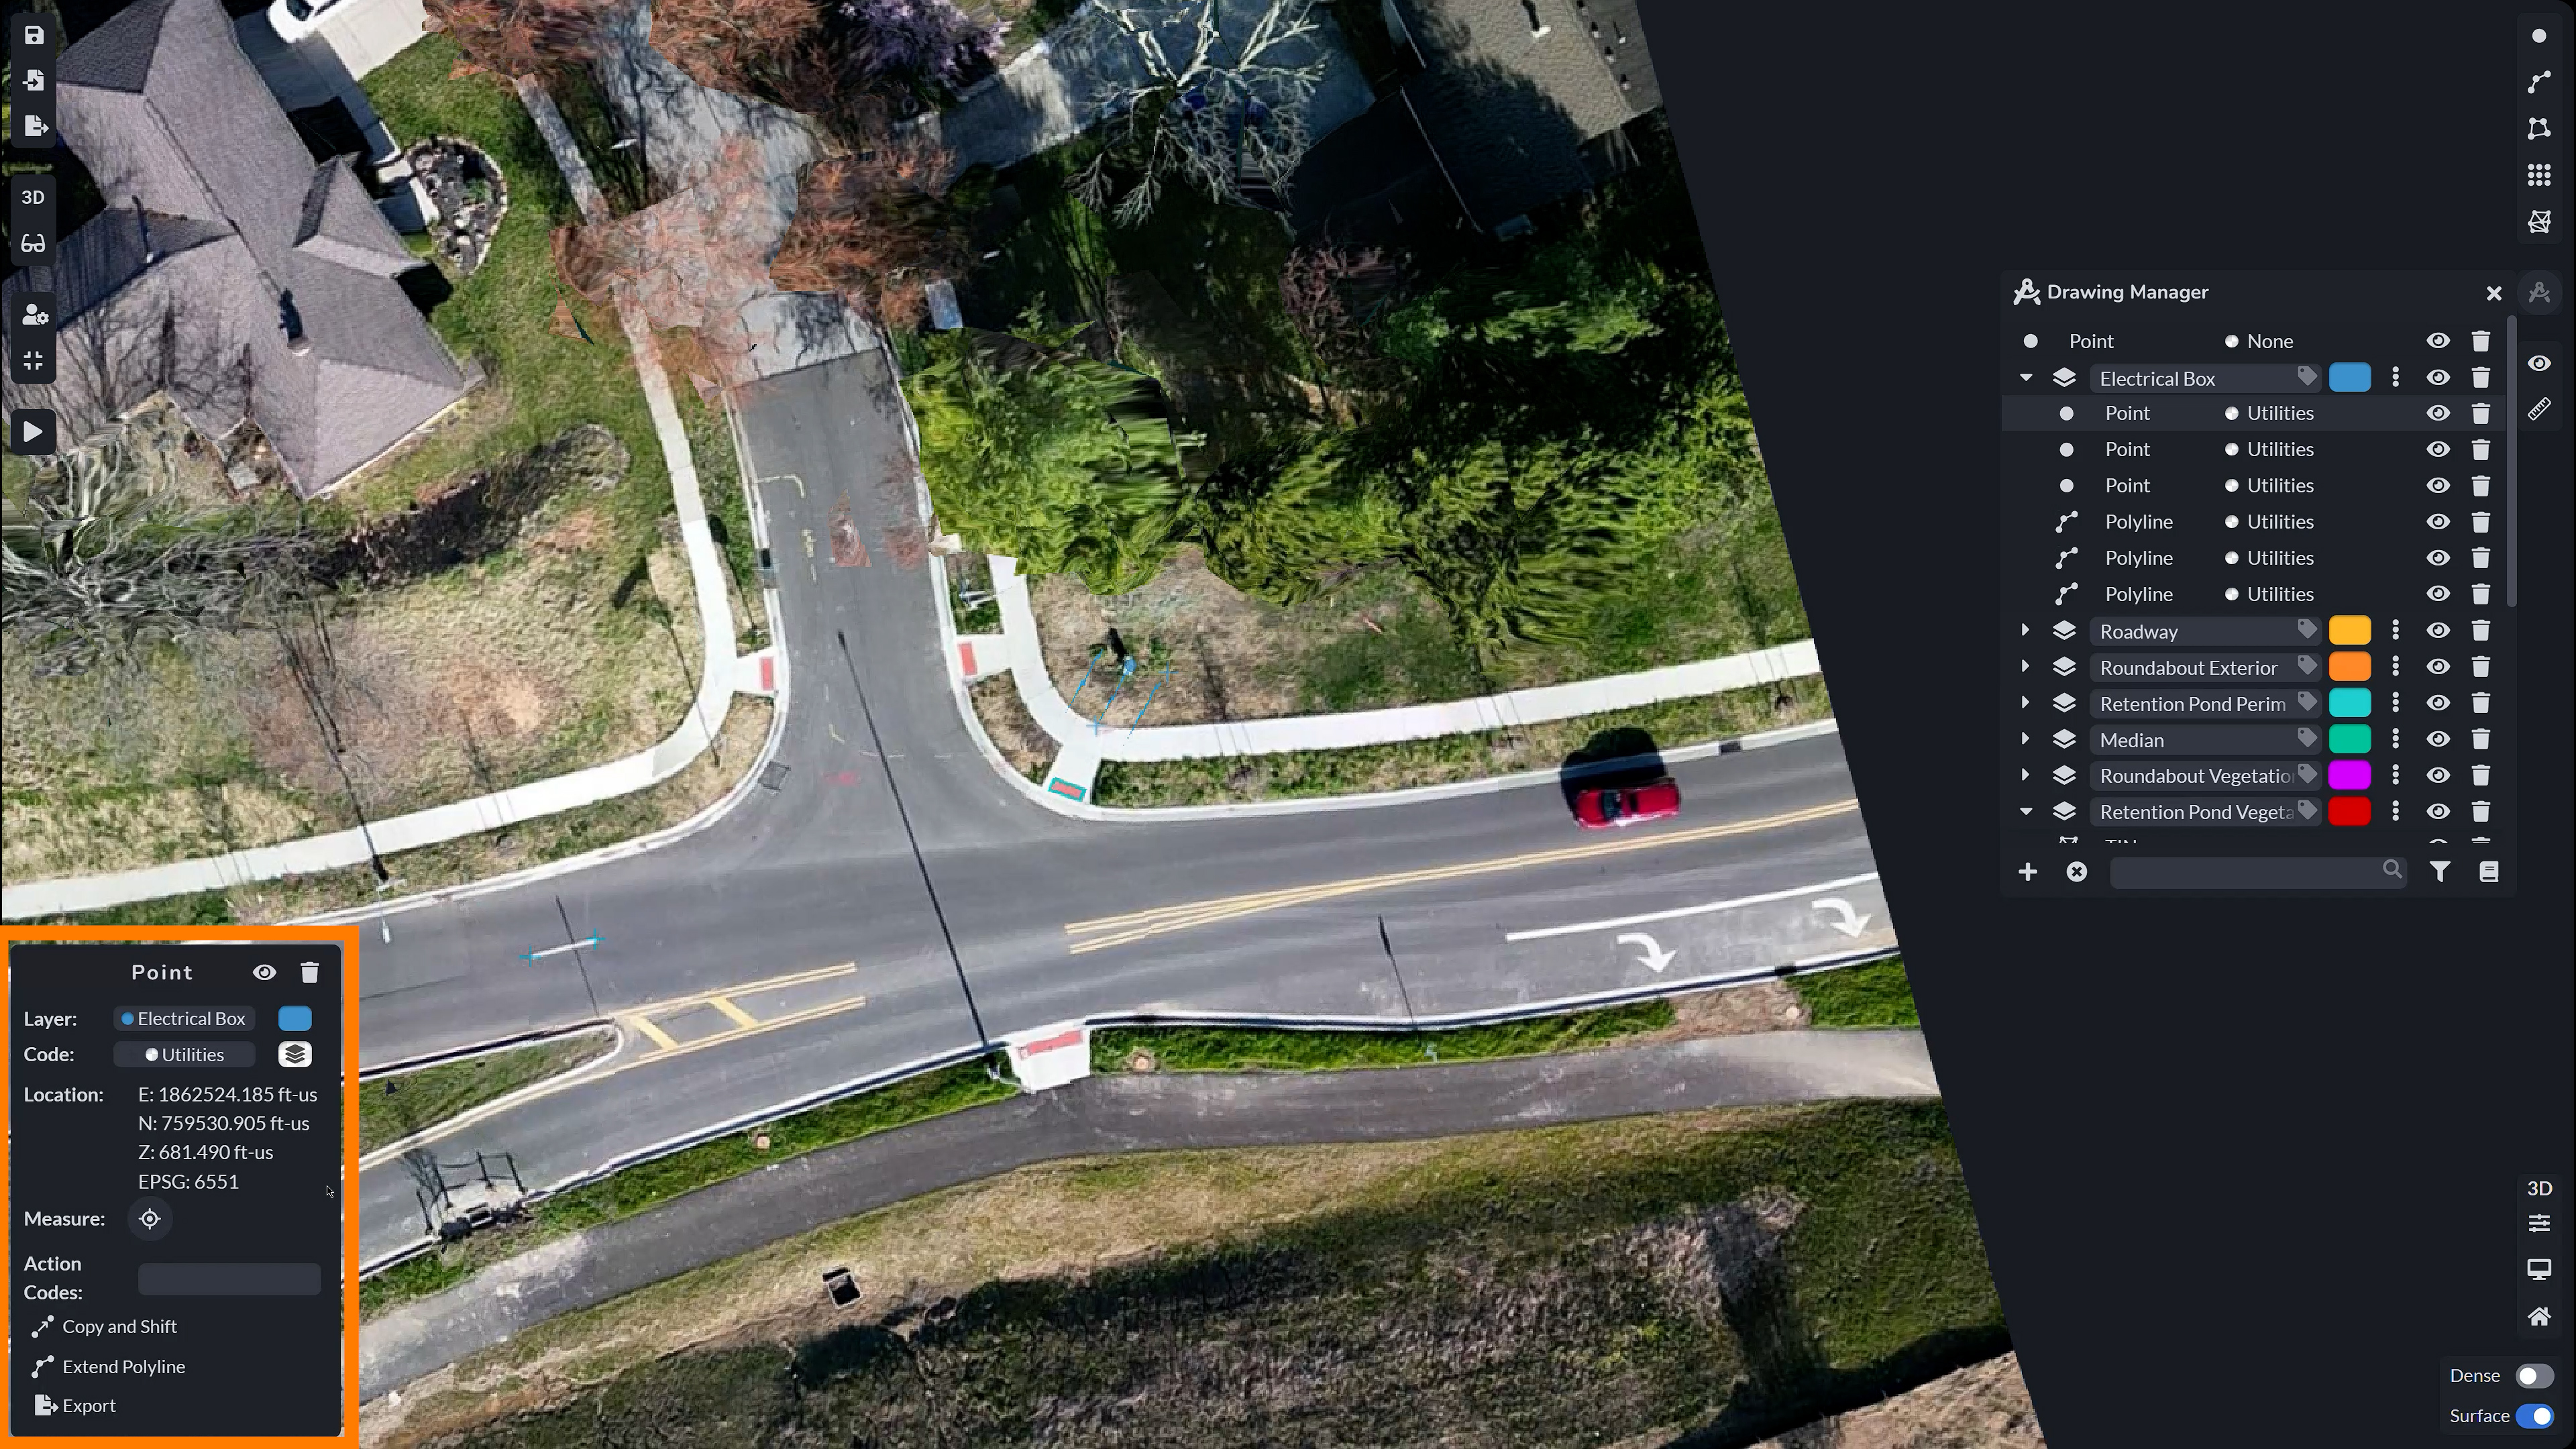
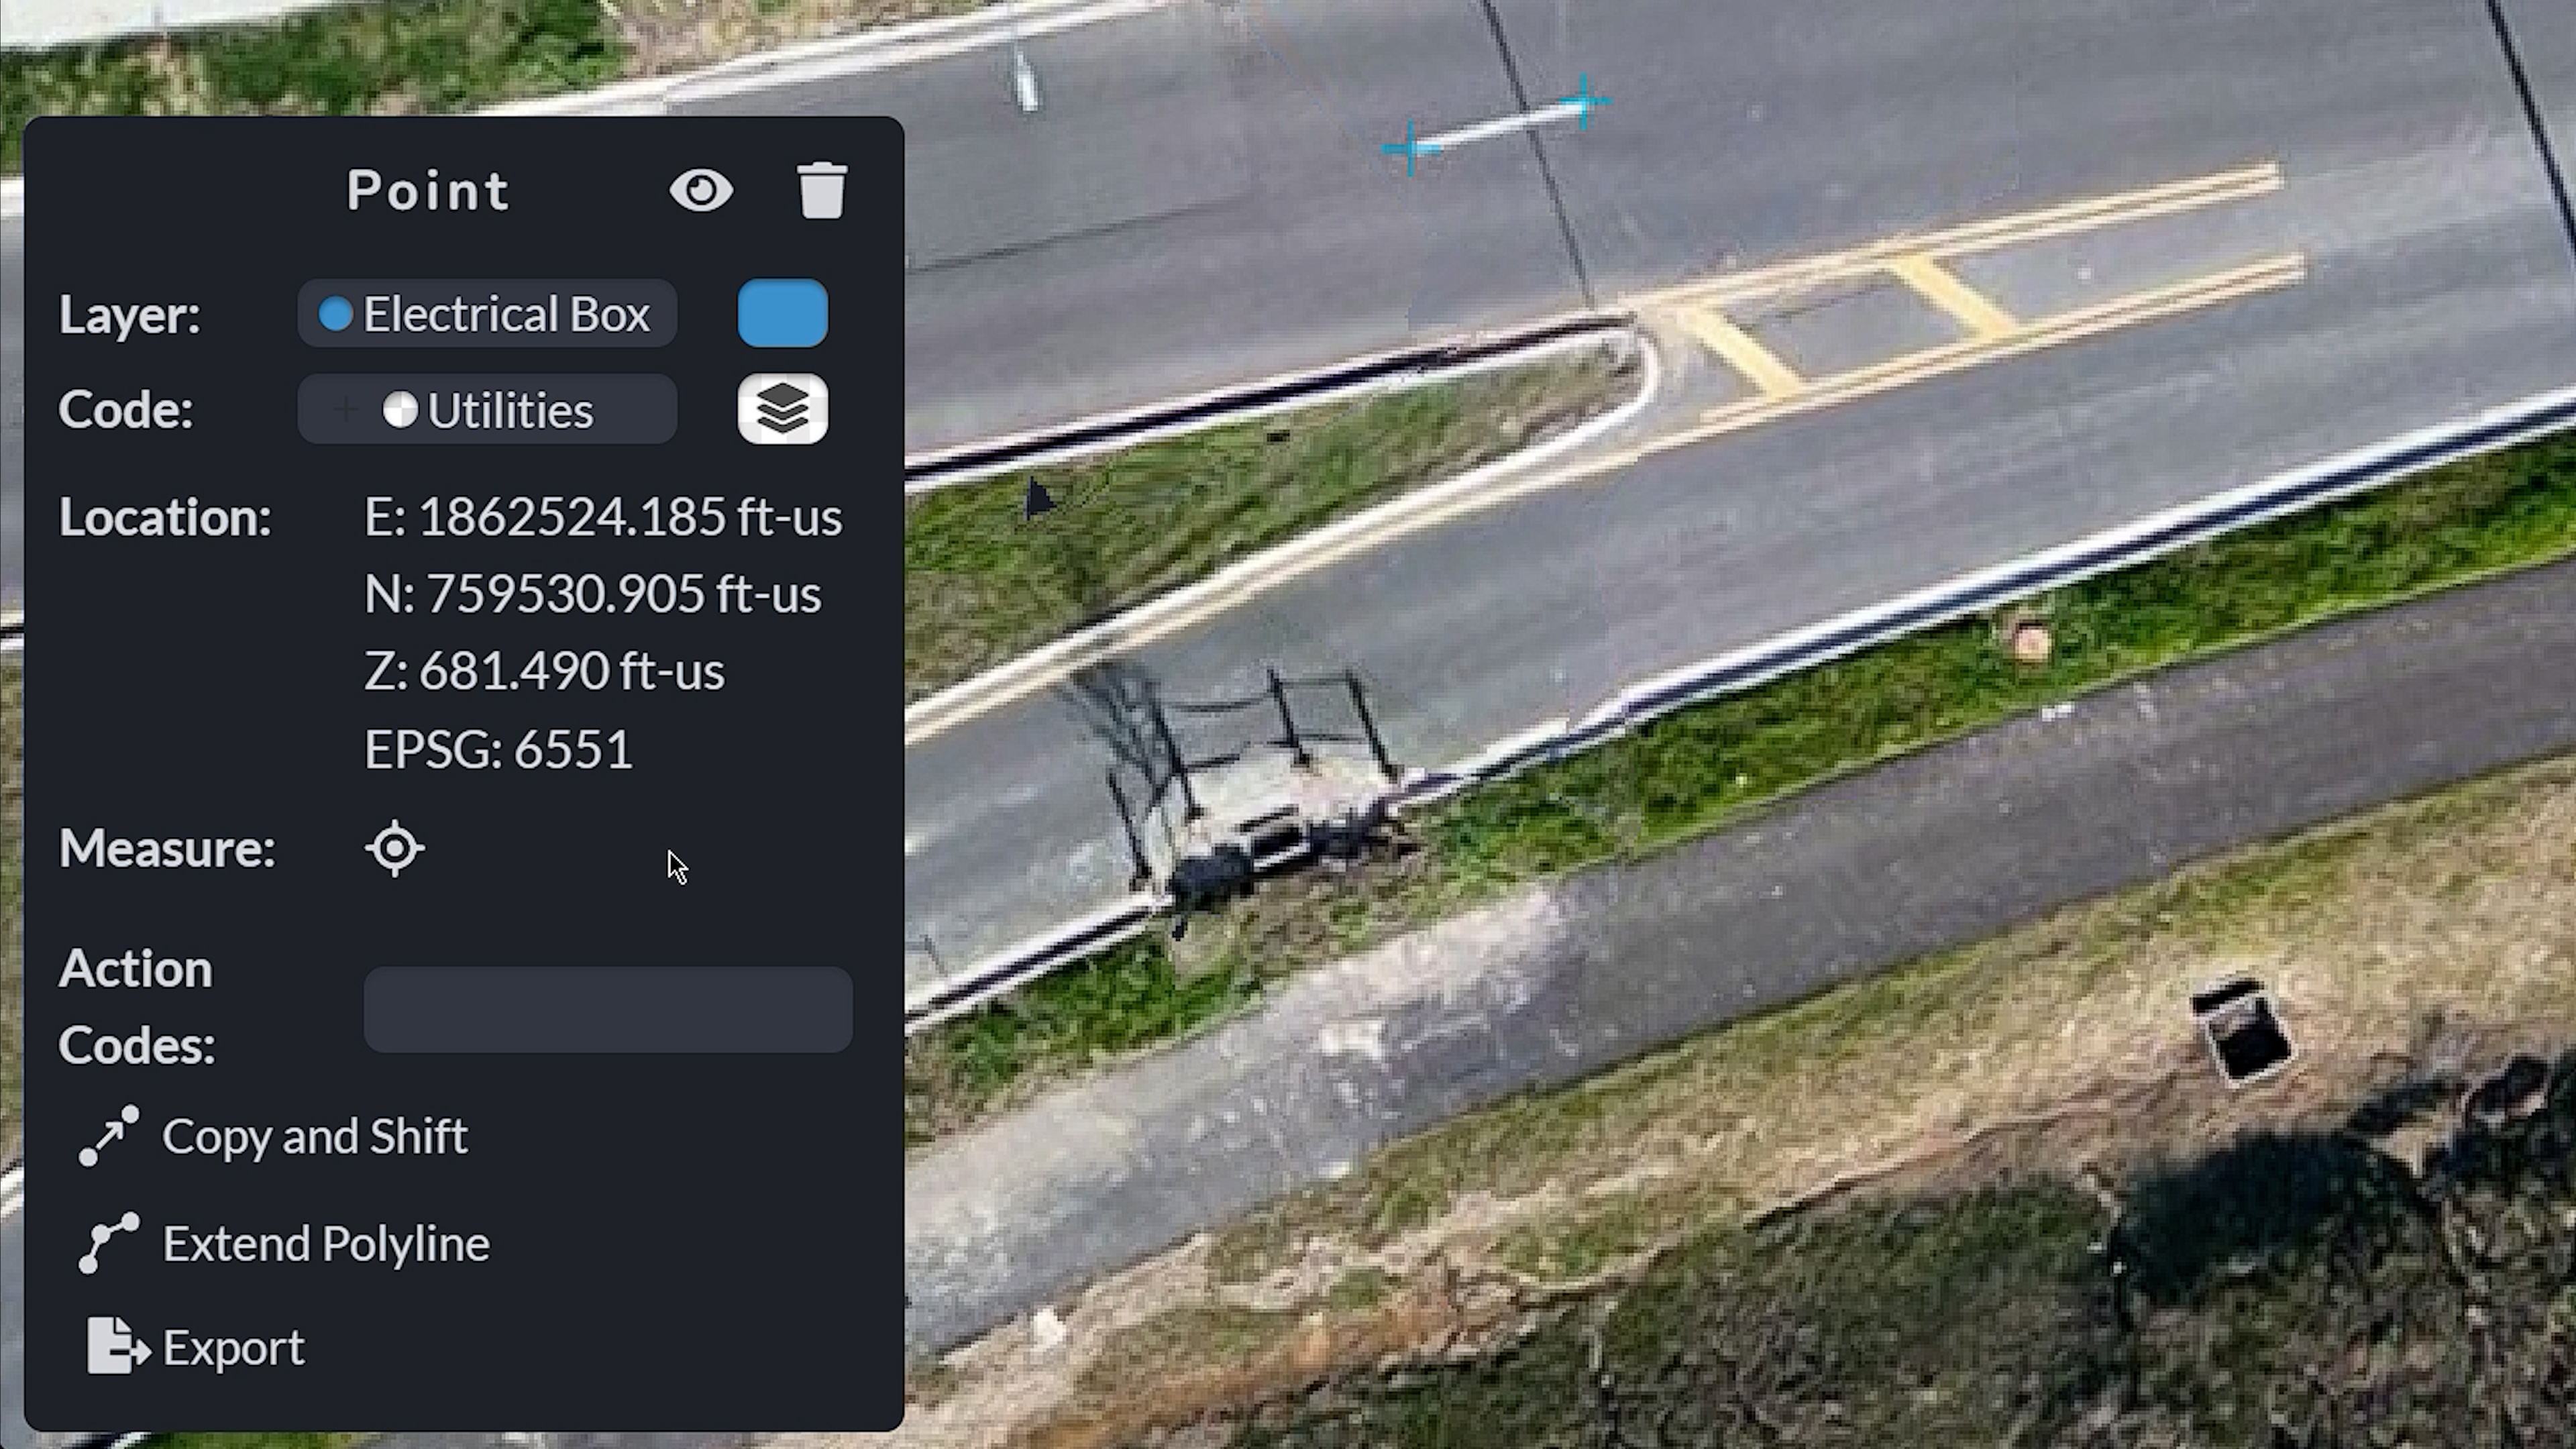
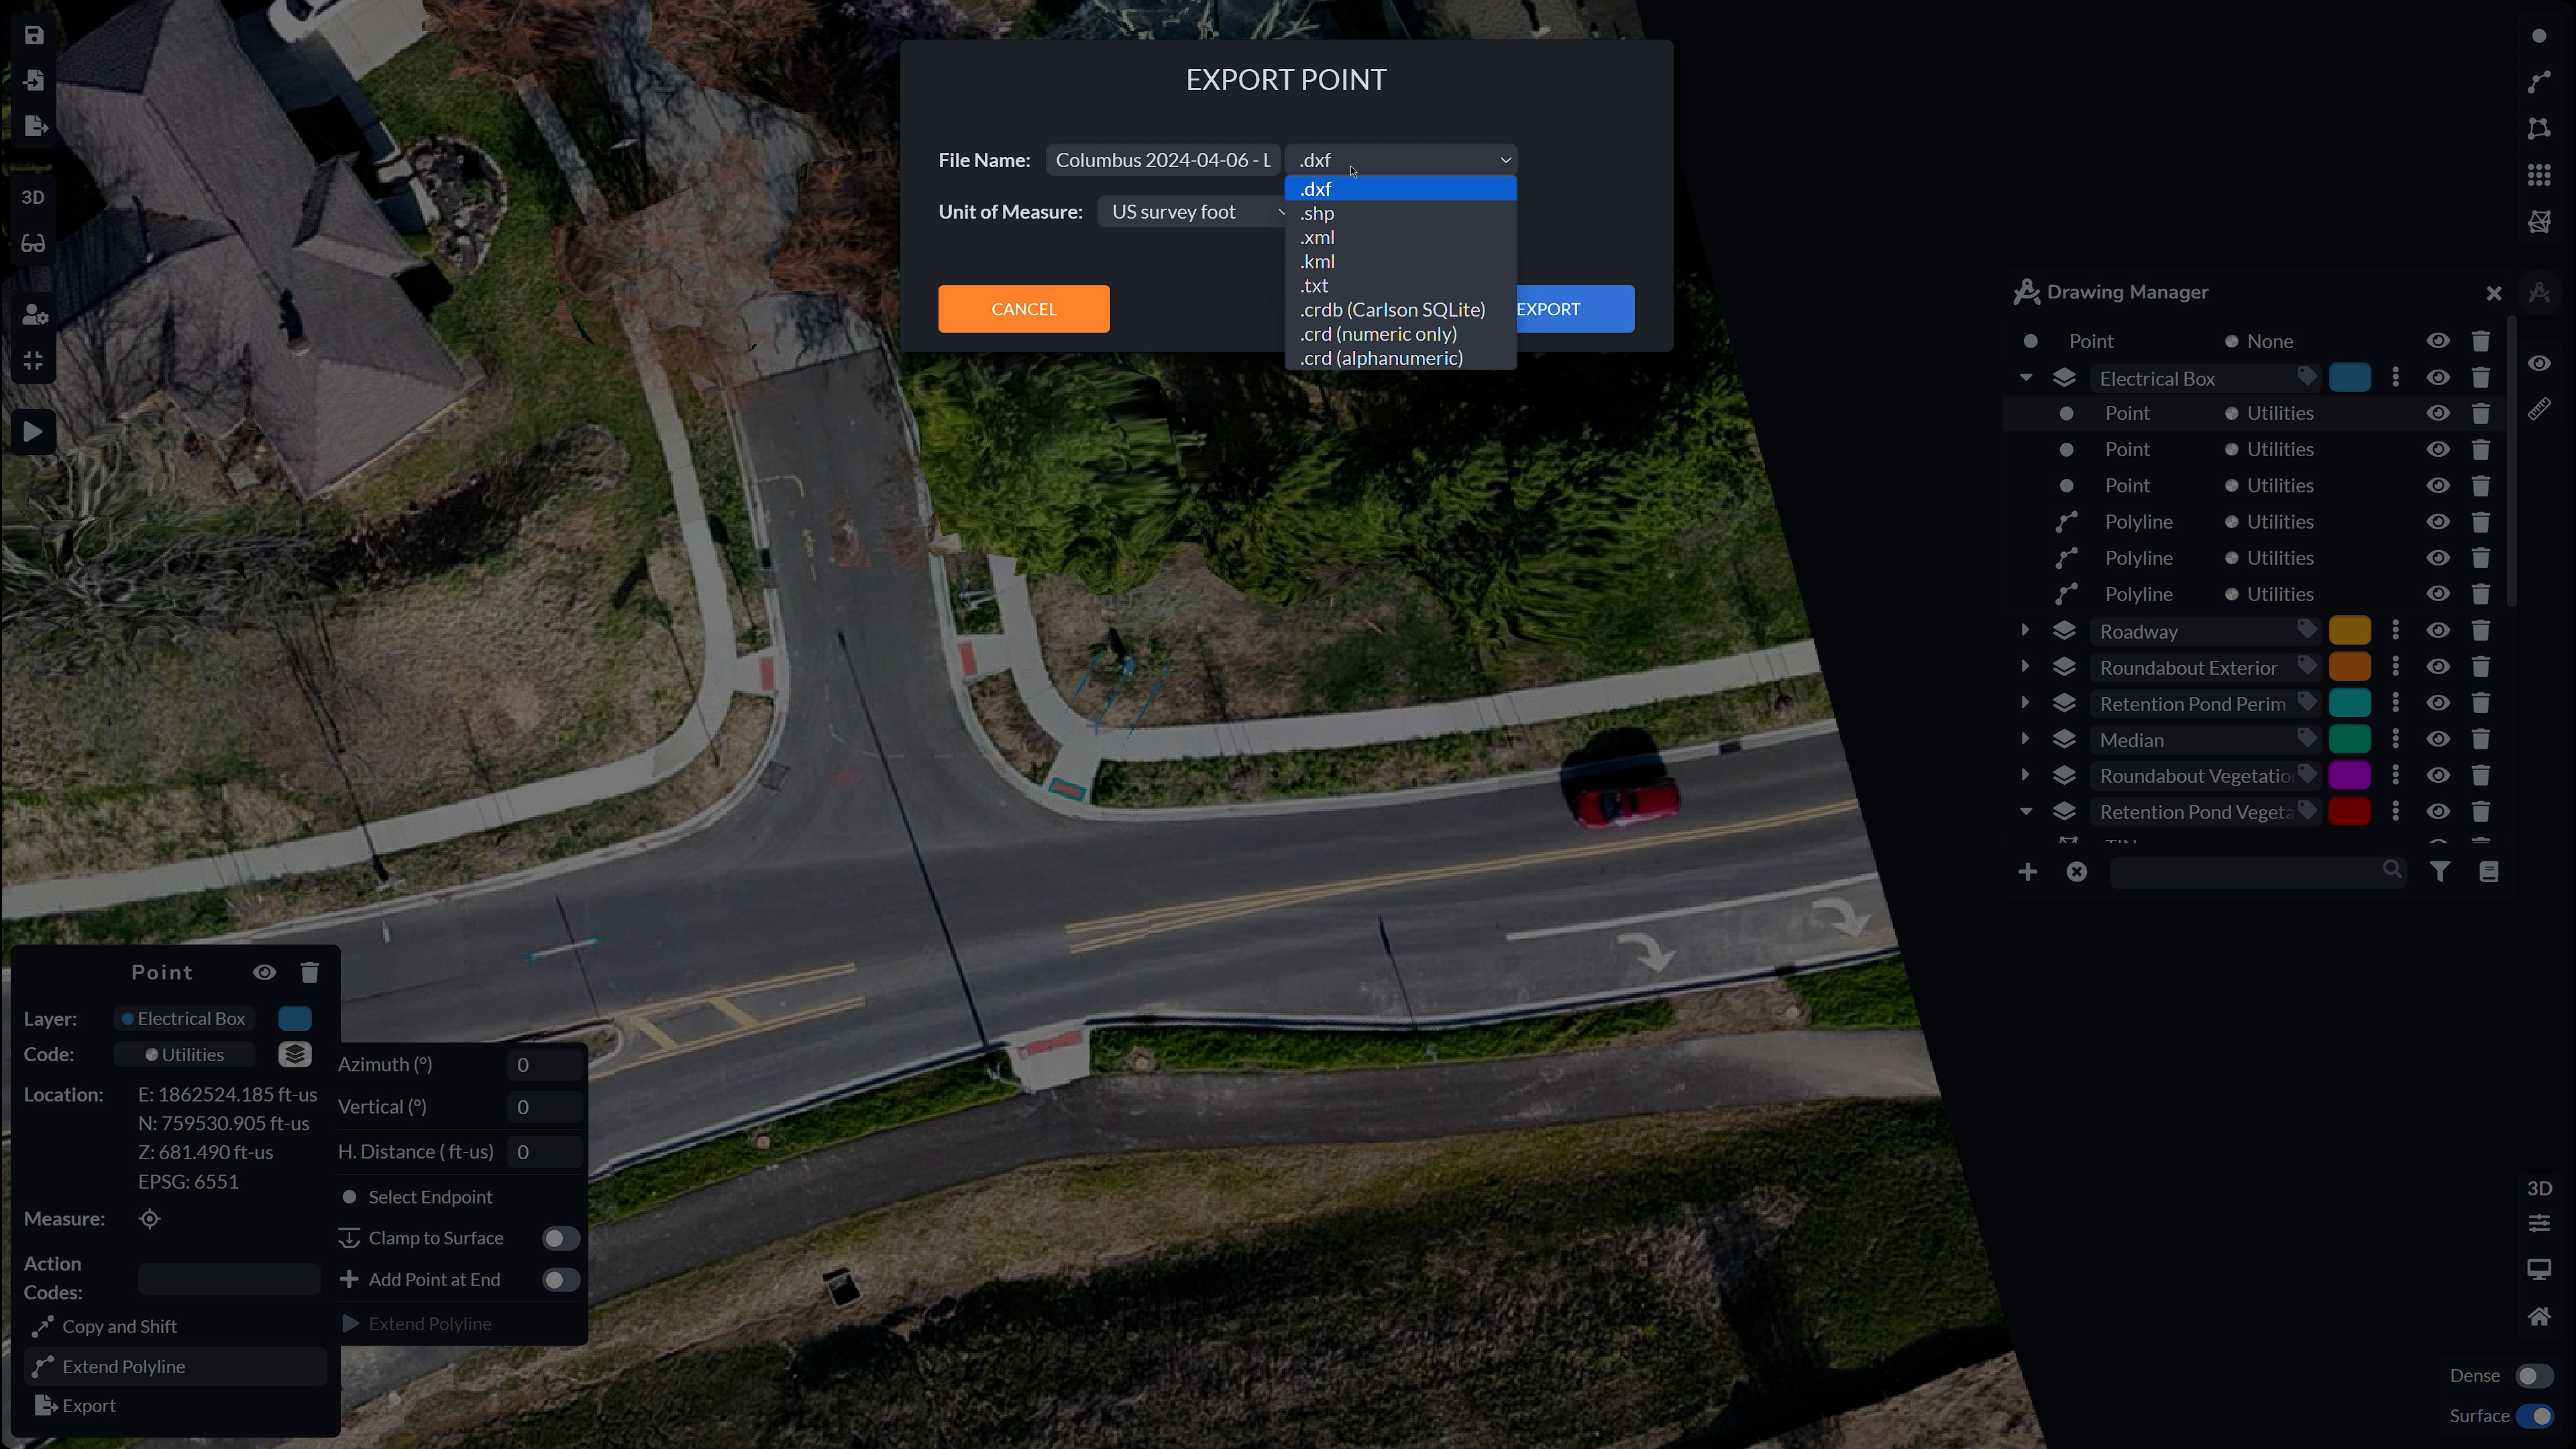
Next, you are also able to copy and shift your point by entering how many feet northing, easting or elevation wise you would like it to shift, extend the point into a polyline by selecting another point to extend to (which can be very useful for traversing when you have a set of distances and directions, for example when mapping from a legal description of a property). You are also able to export the point to the following formats.

To add a Polyline, you can select and label your layers like before and create a connected sequence of line segments.
Polylines are commonly used to represent linear features such as roads, rivers, railways, boundaries, pipelines, and other linear infrastructure on a map.
Each polyline in GIS annotation can be associated with attributes that provide additional information about the feature it represents. These attributes can include things like the name of a road, the type of infrastructure, or any other relevant metadata.
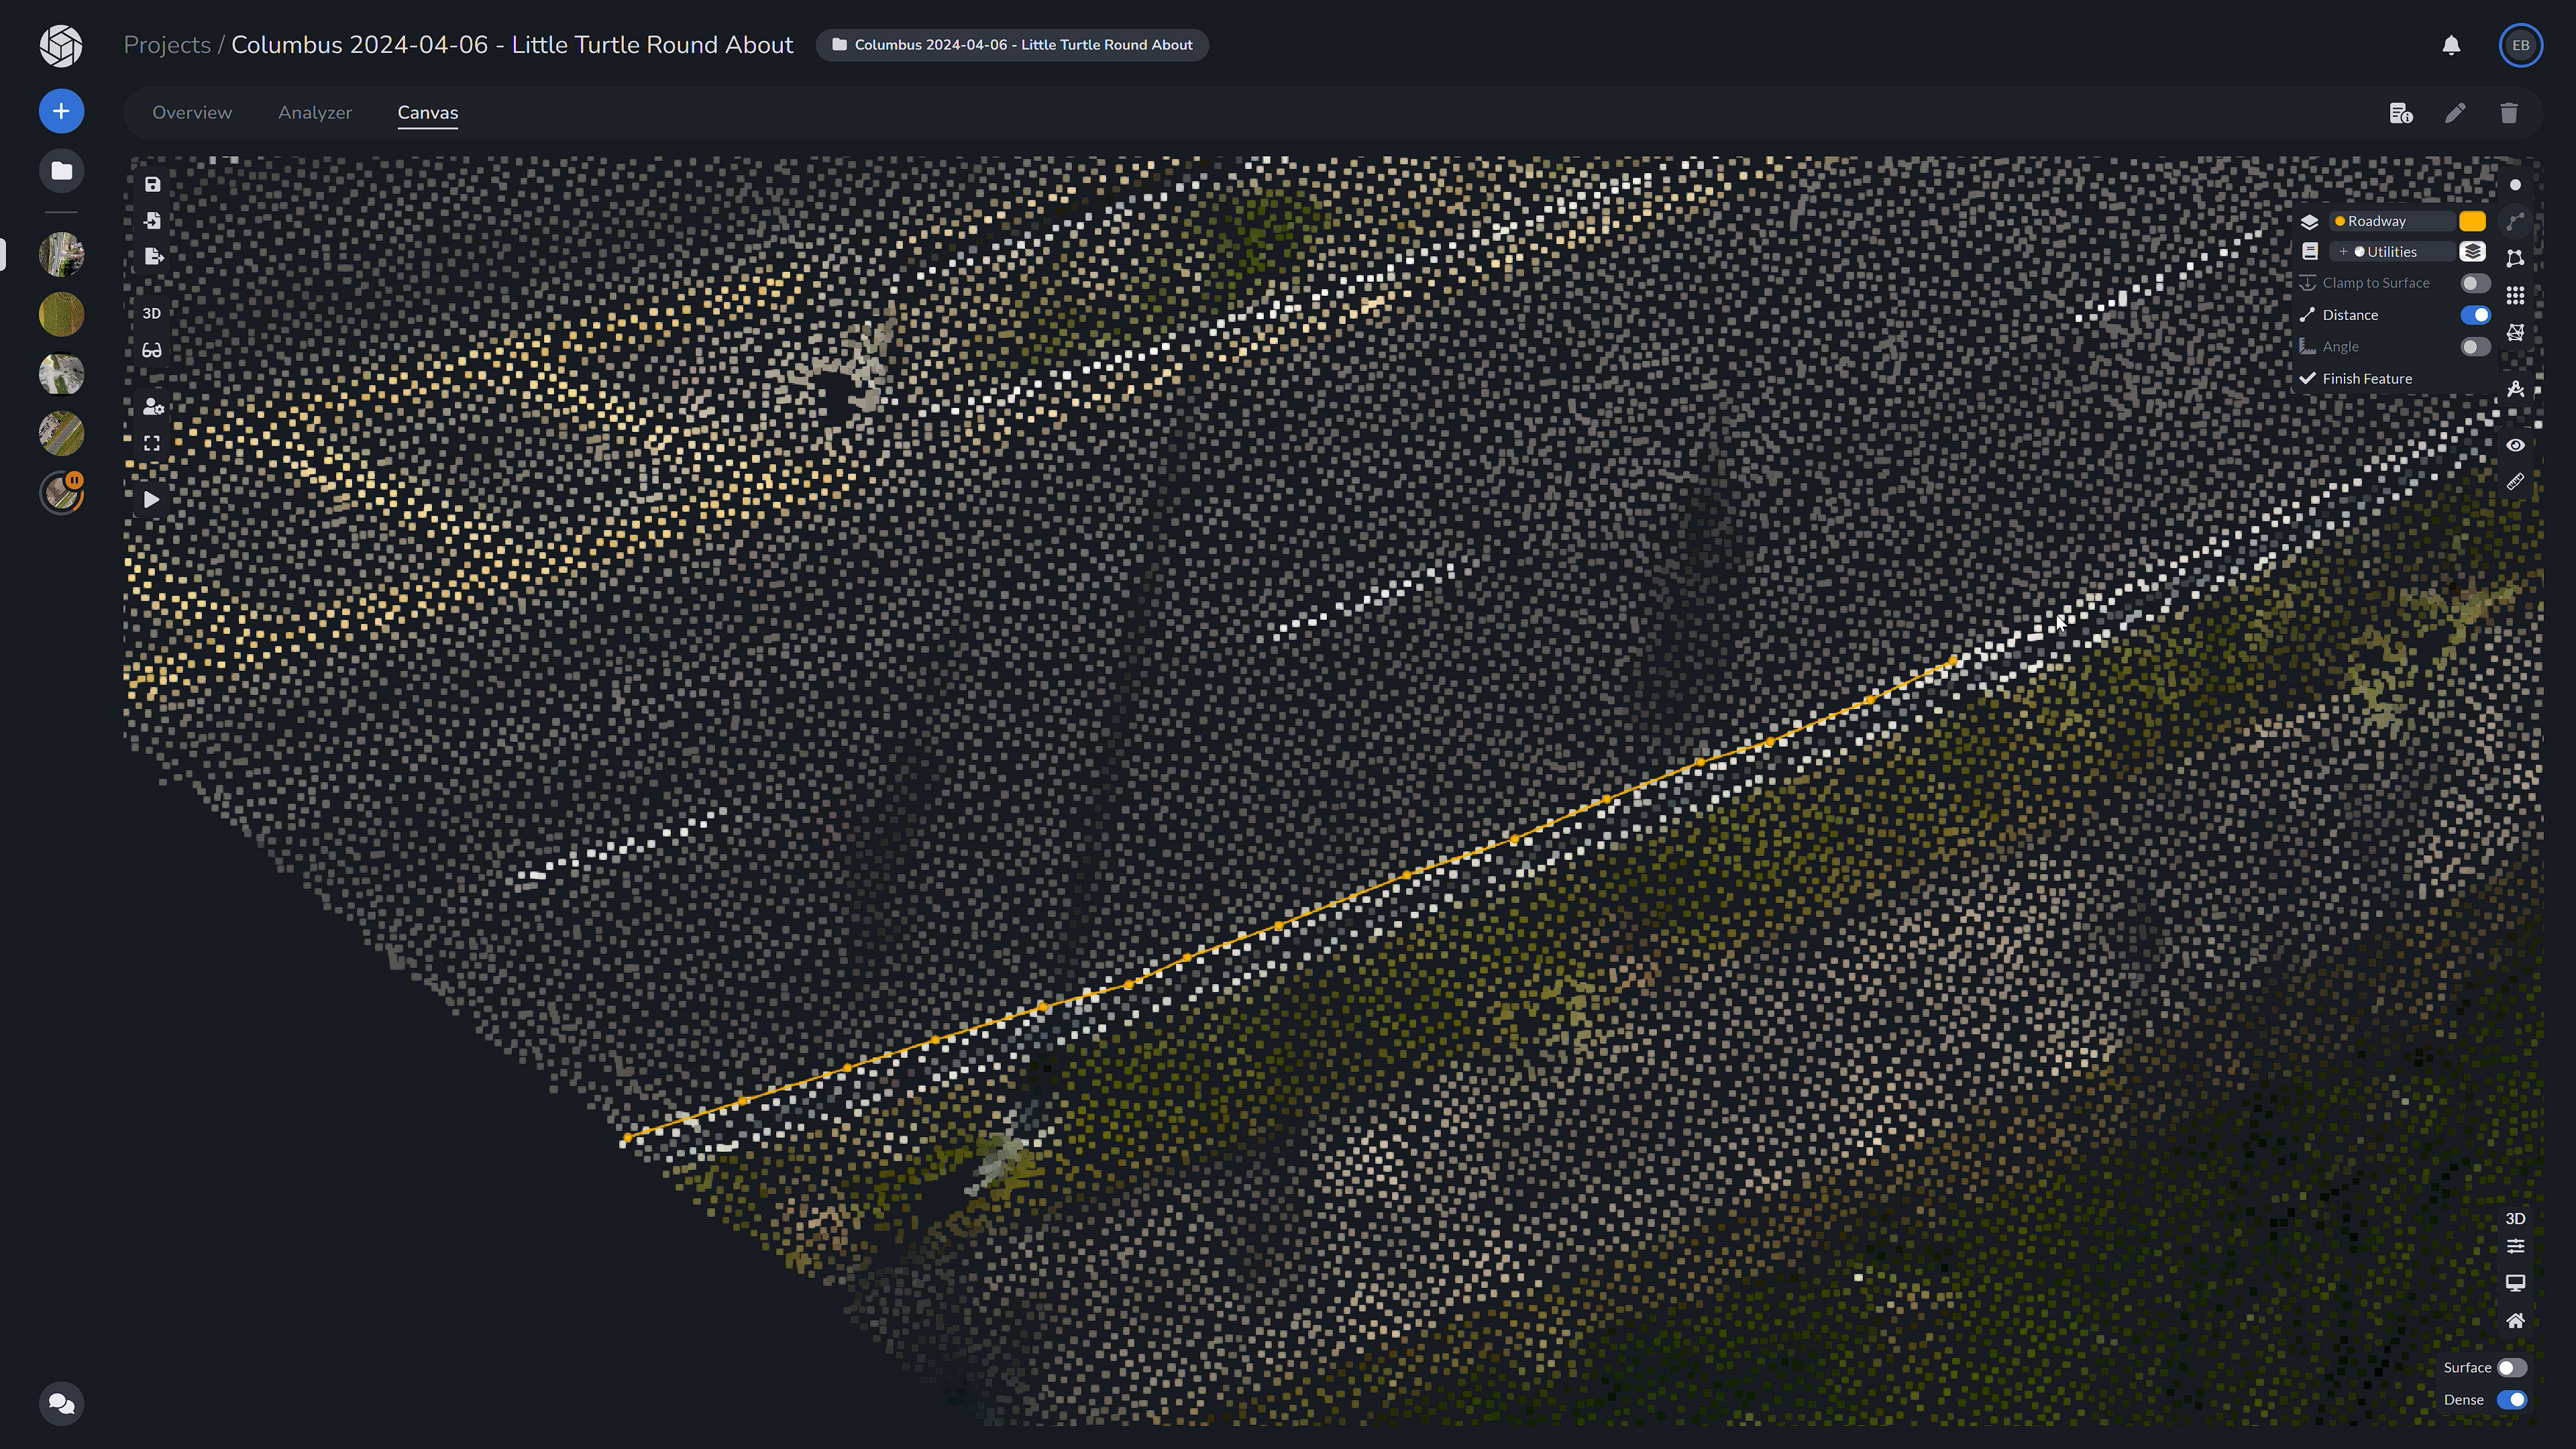
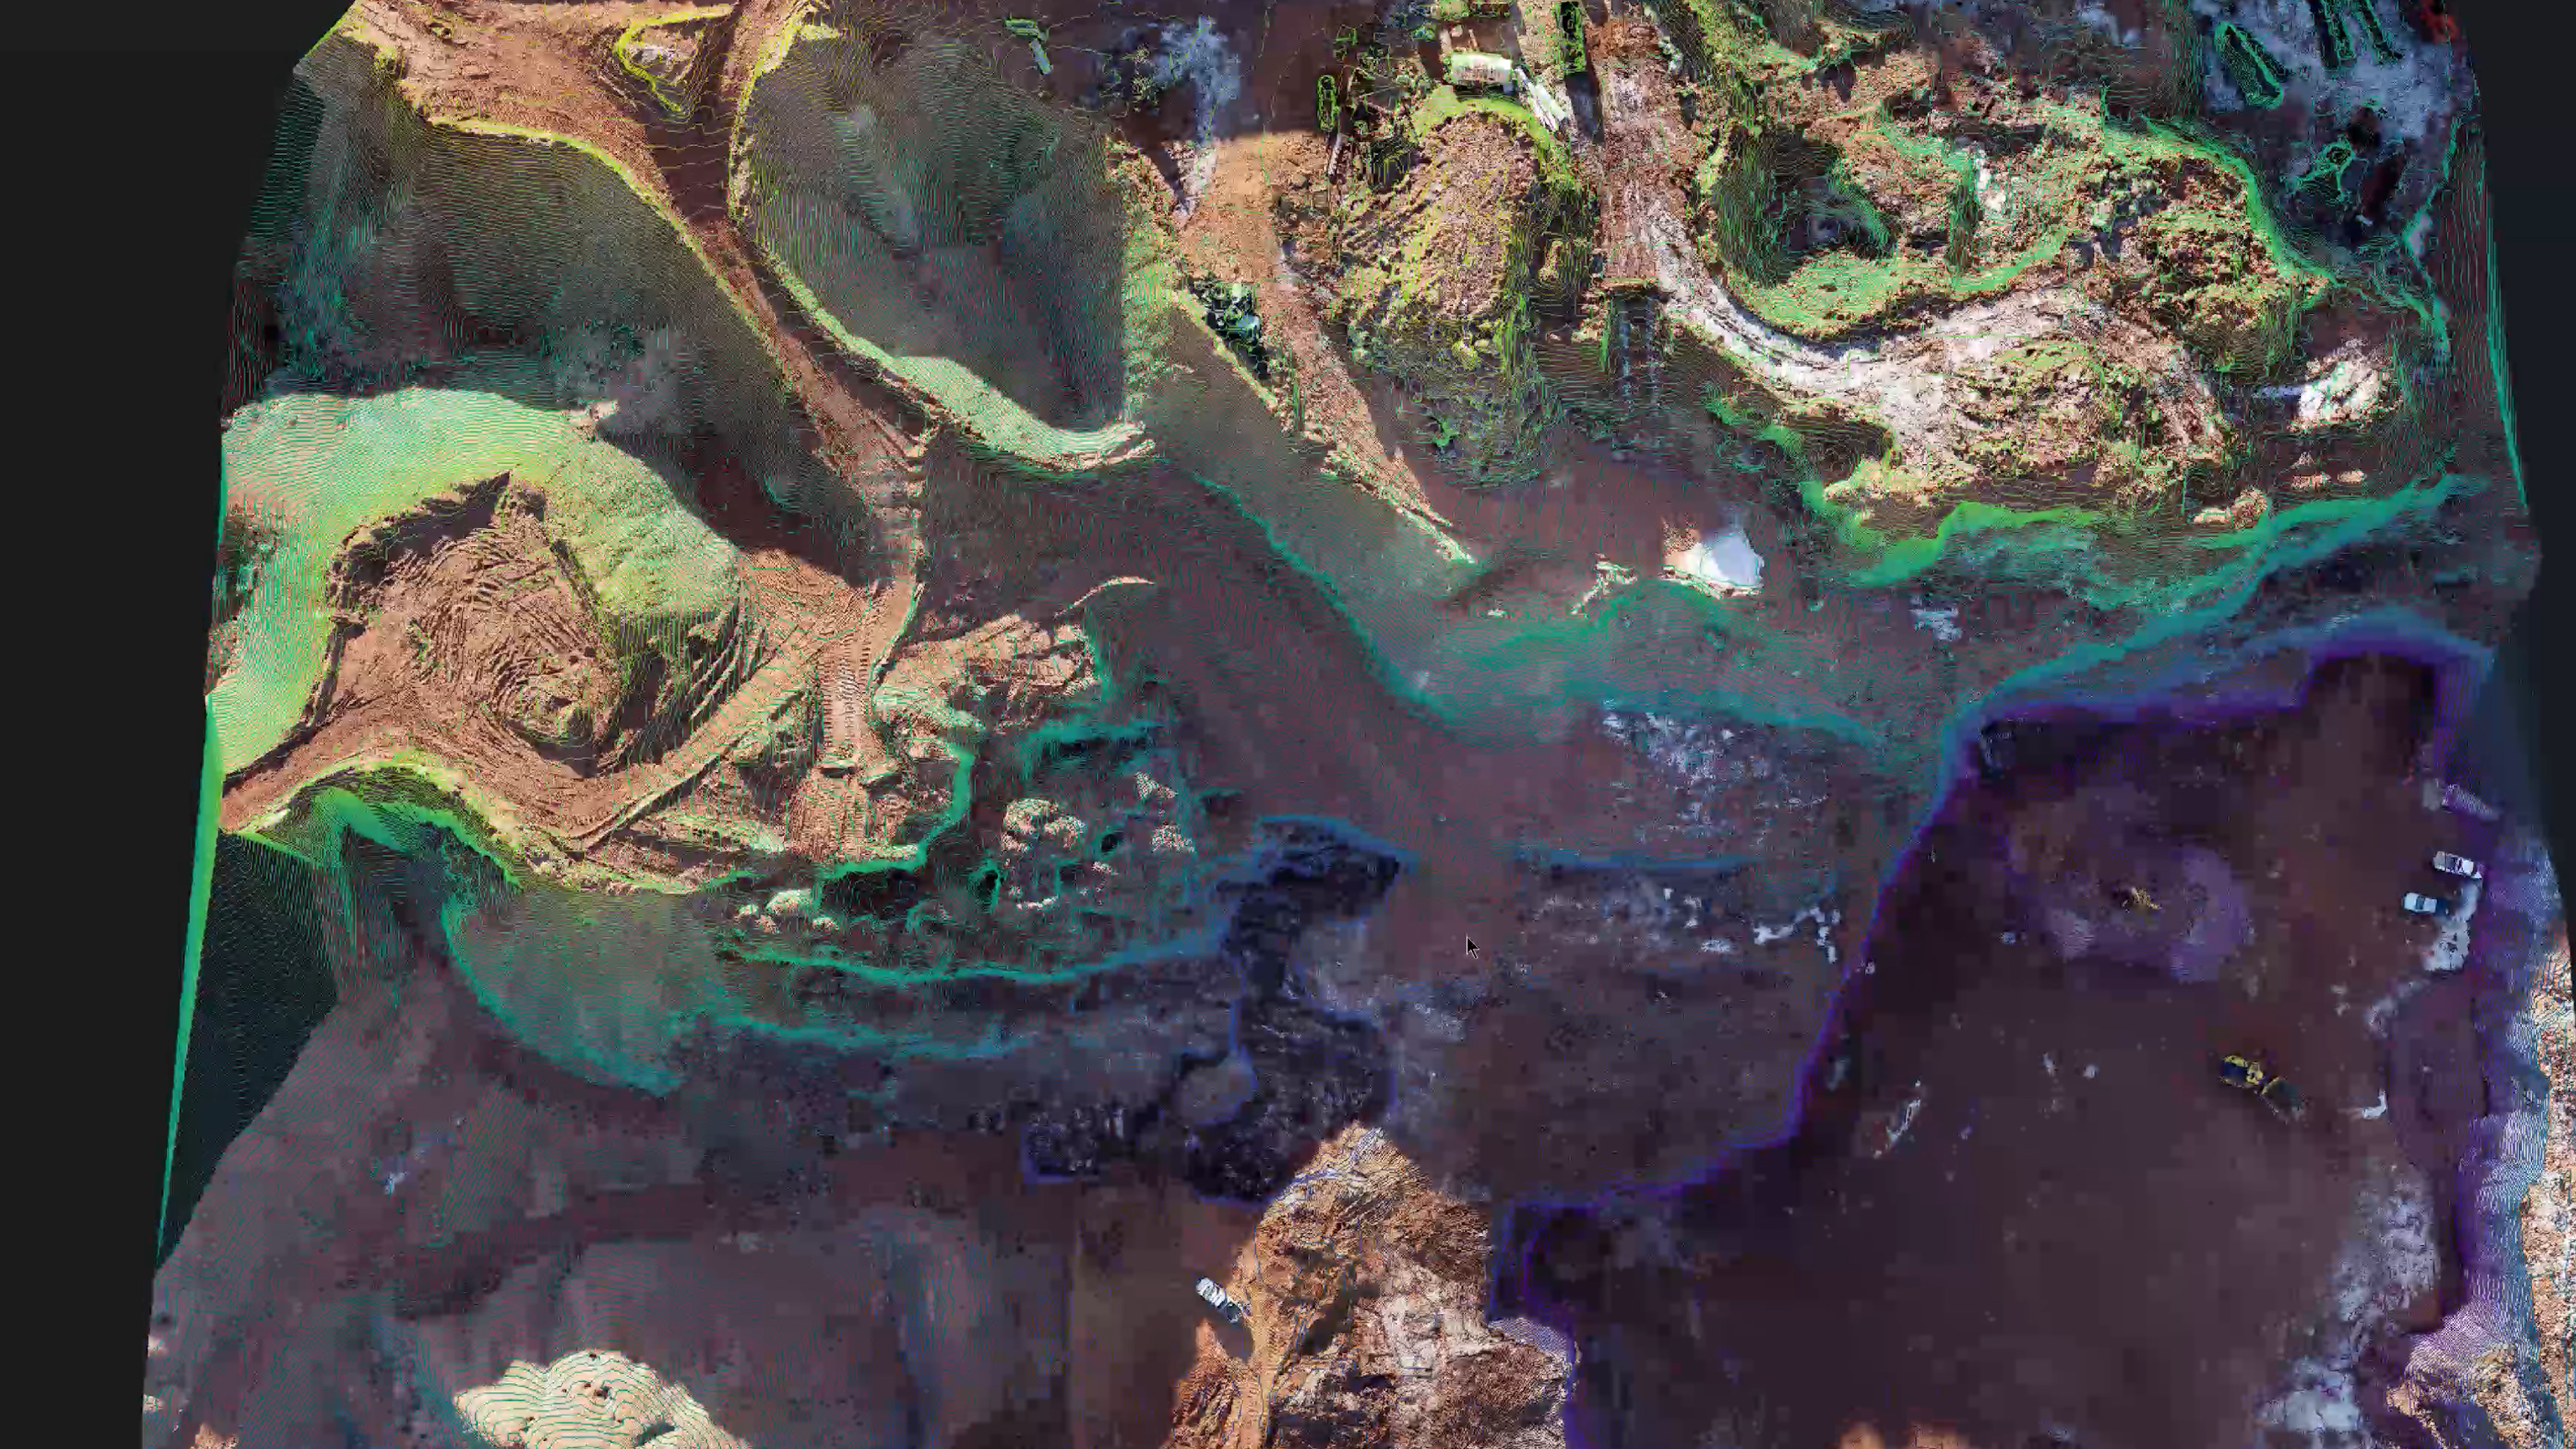
You are able to make annotations while in the dense point cloud and/or surface model view in the canvas. Due to the data being decimated in the surface model, there can be a loss of precision near sharp vertical boundaries, like a curb edge. Therefore, we recommend when needing precise measurements you use the dense point cloud view toggle.
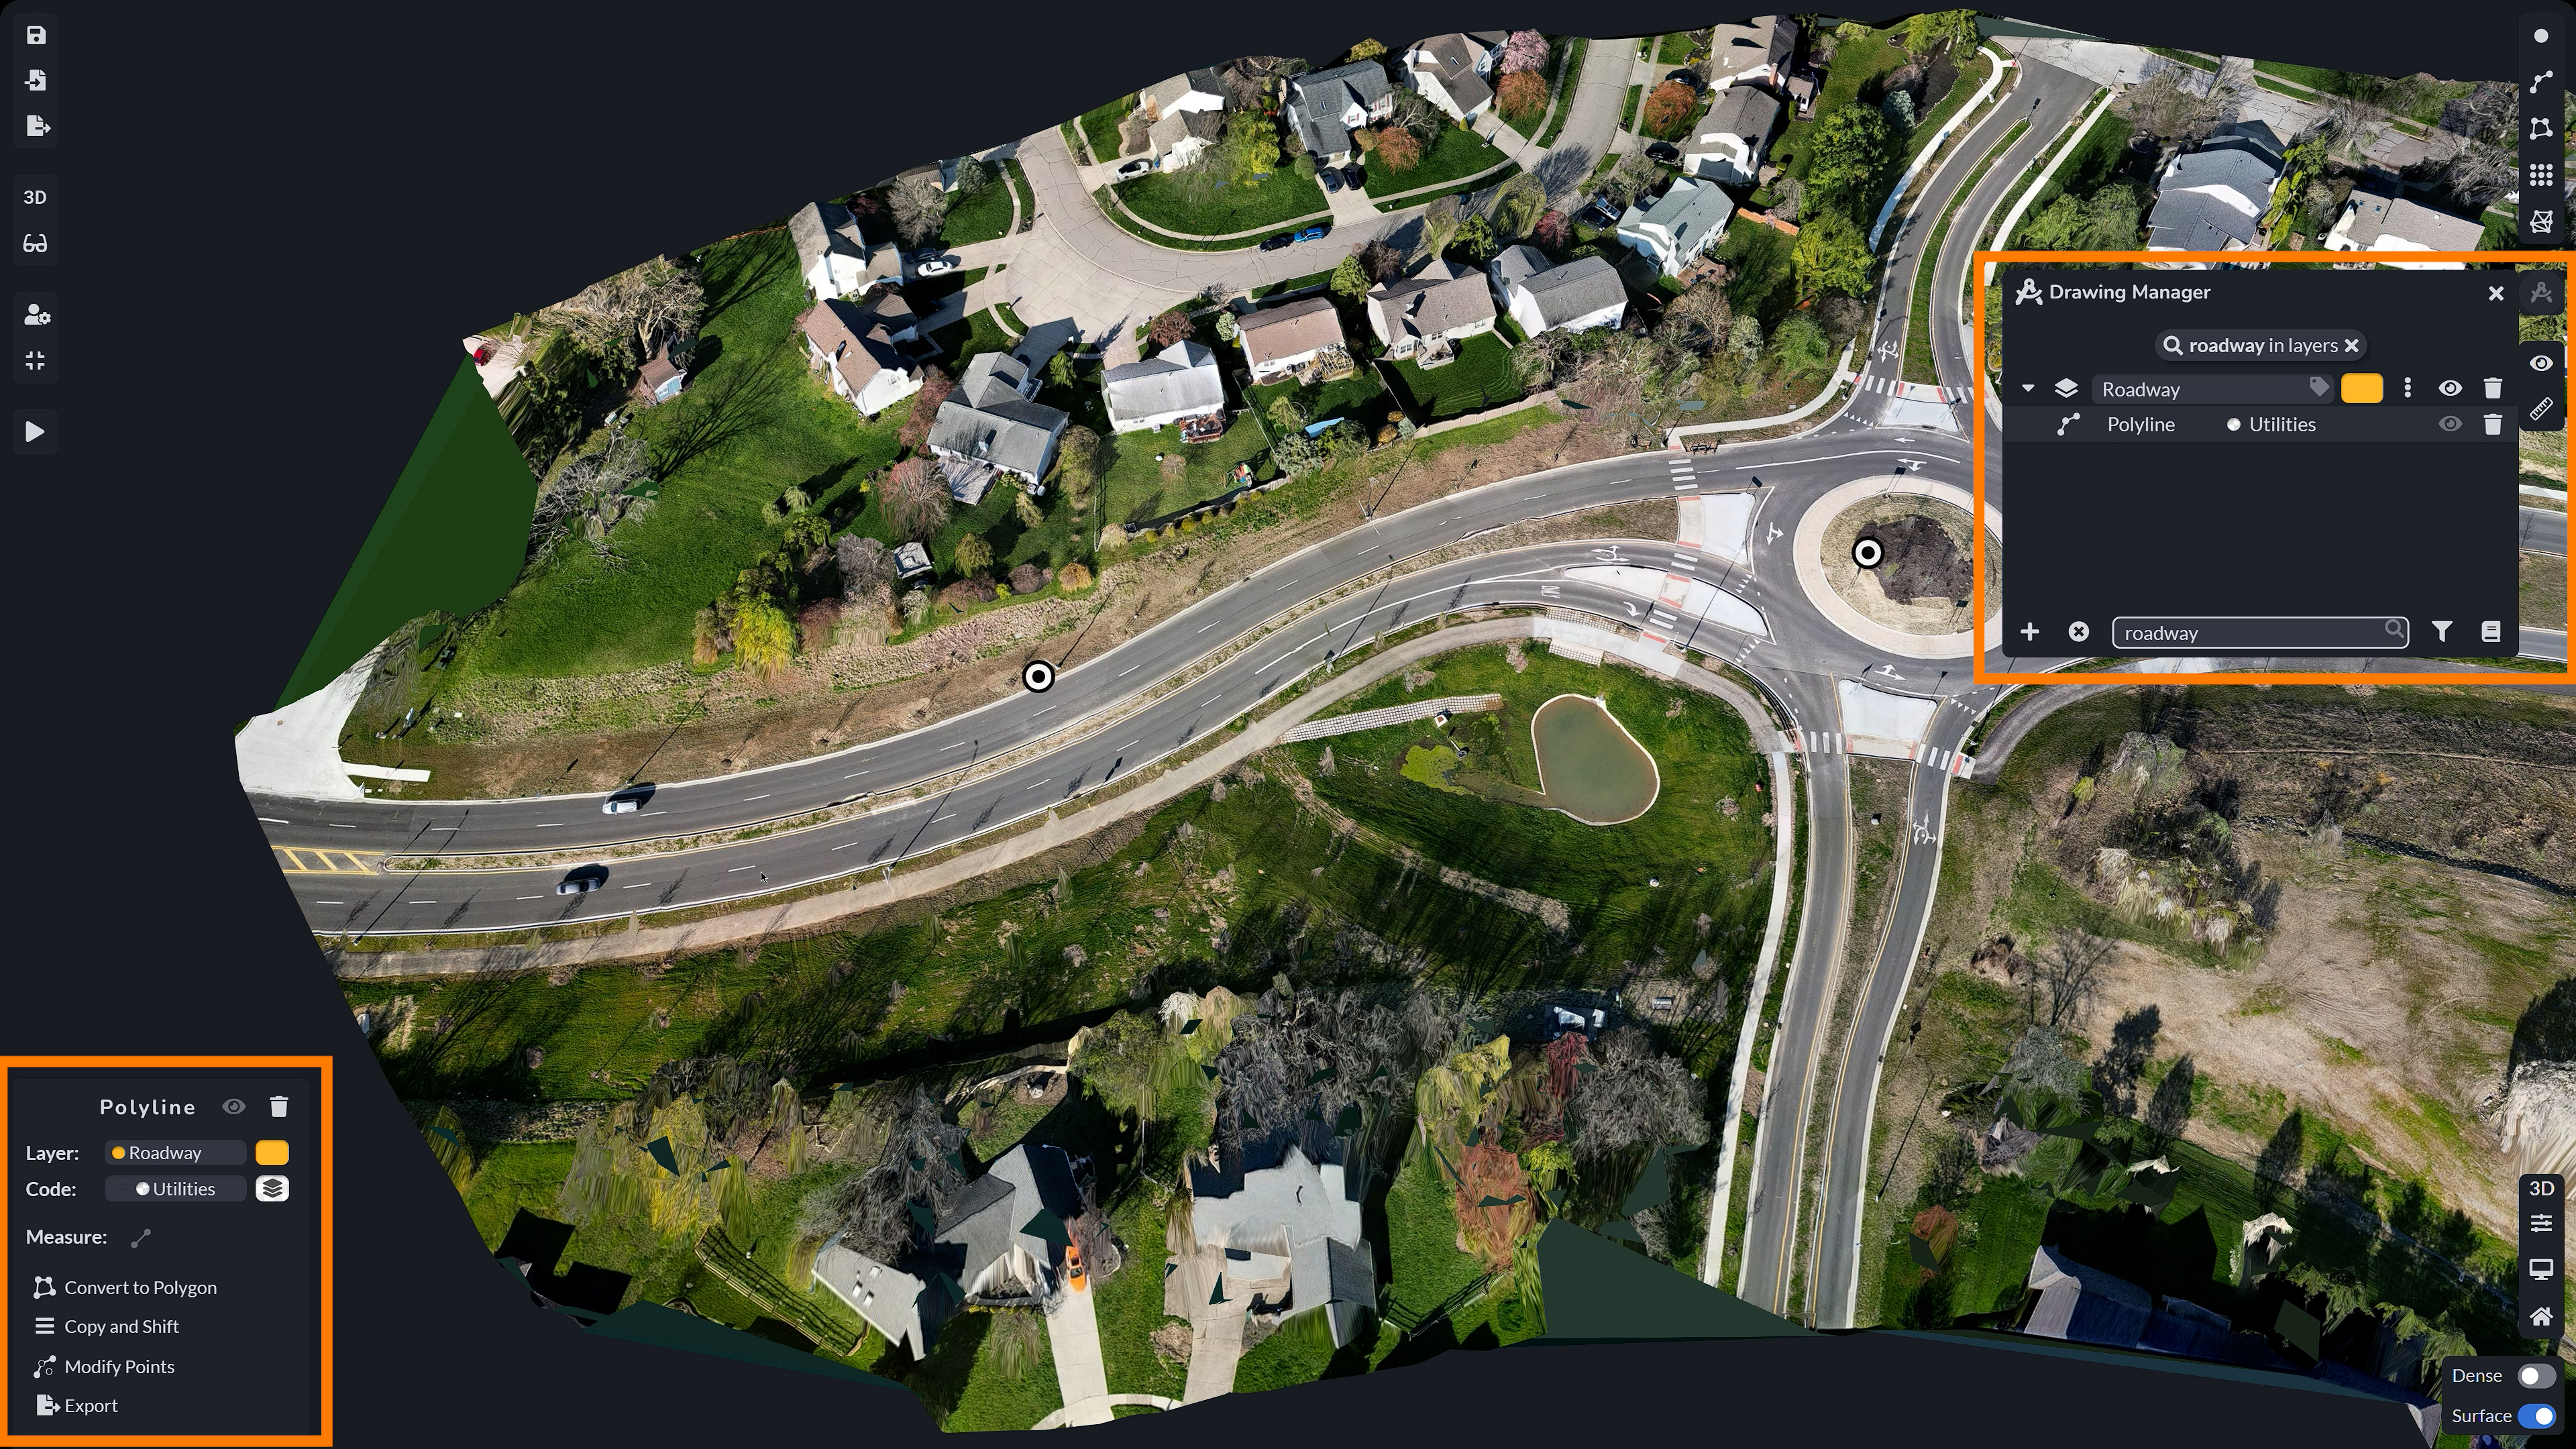
Once you make a polyline, you can select it from the drawing manager and a menu will appear on the bottom left where you can convert it to a polygon, copy and shift the lines by 90 degree positive or negative offsets by setting your distance you want the copied line to be shifted (which is used in drilling applications and planning as well as marking parking lots, for example). You are also able to modify points by adding or deleting points as well as exporting the polyline to your desired needs.

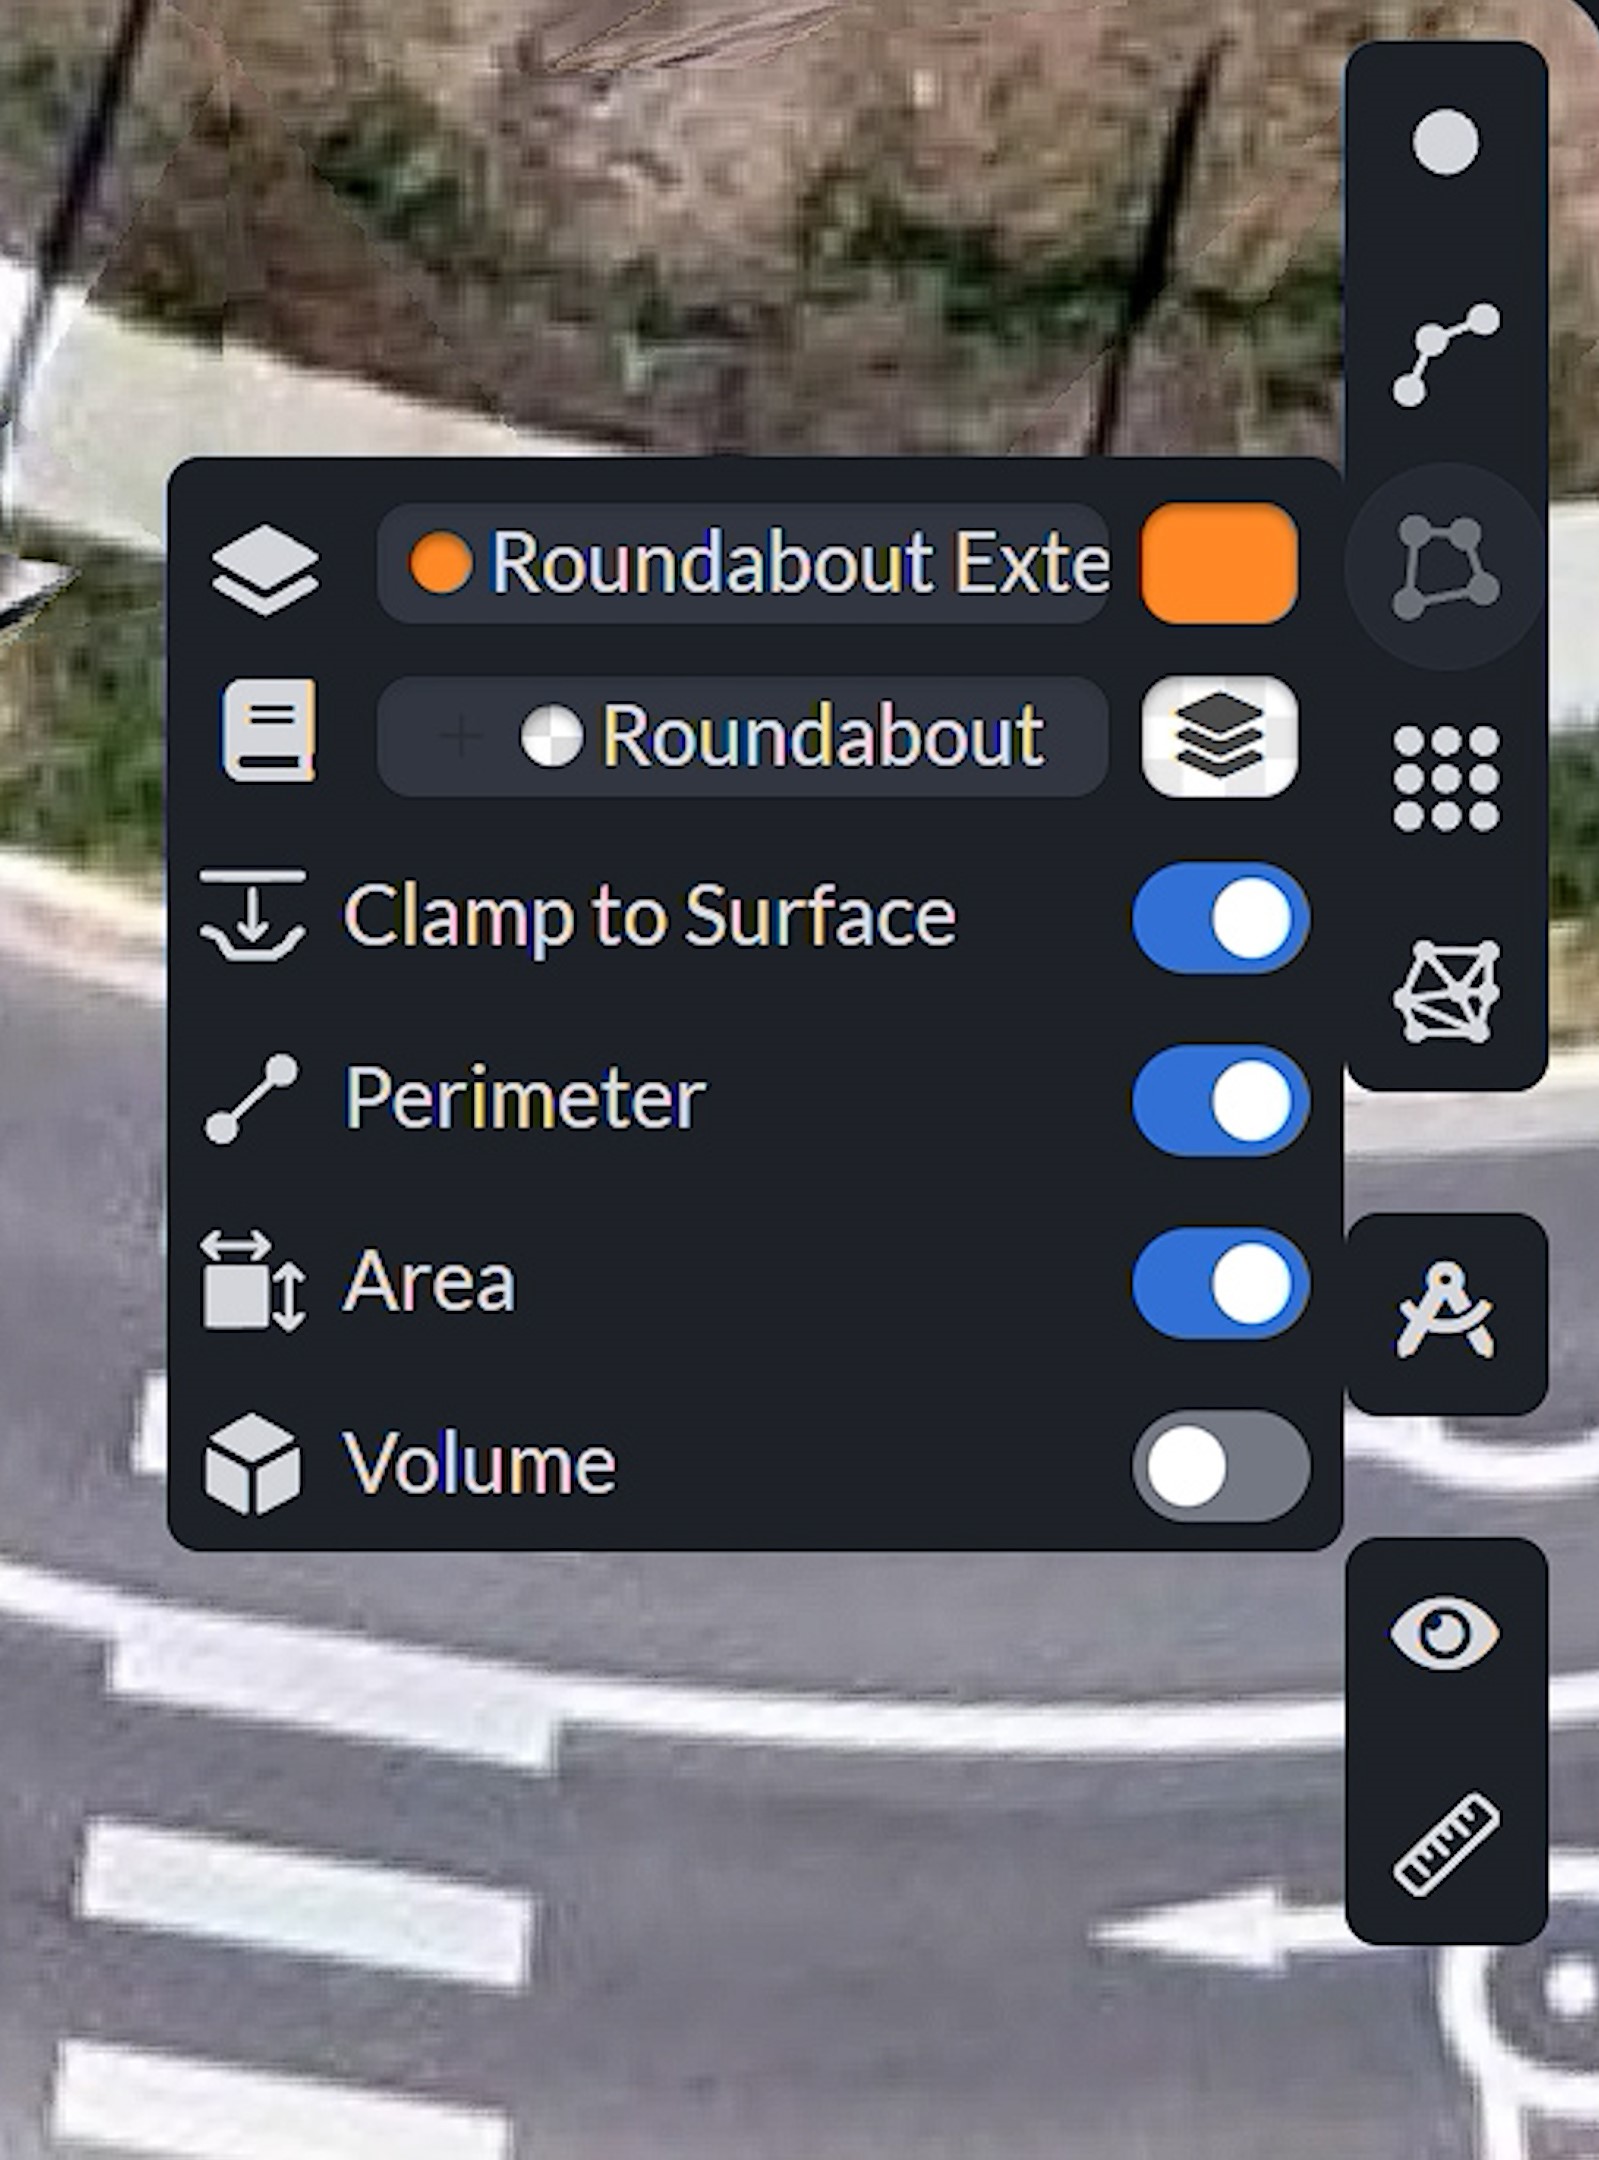
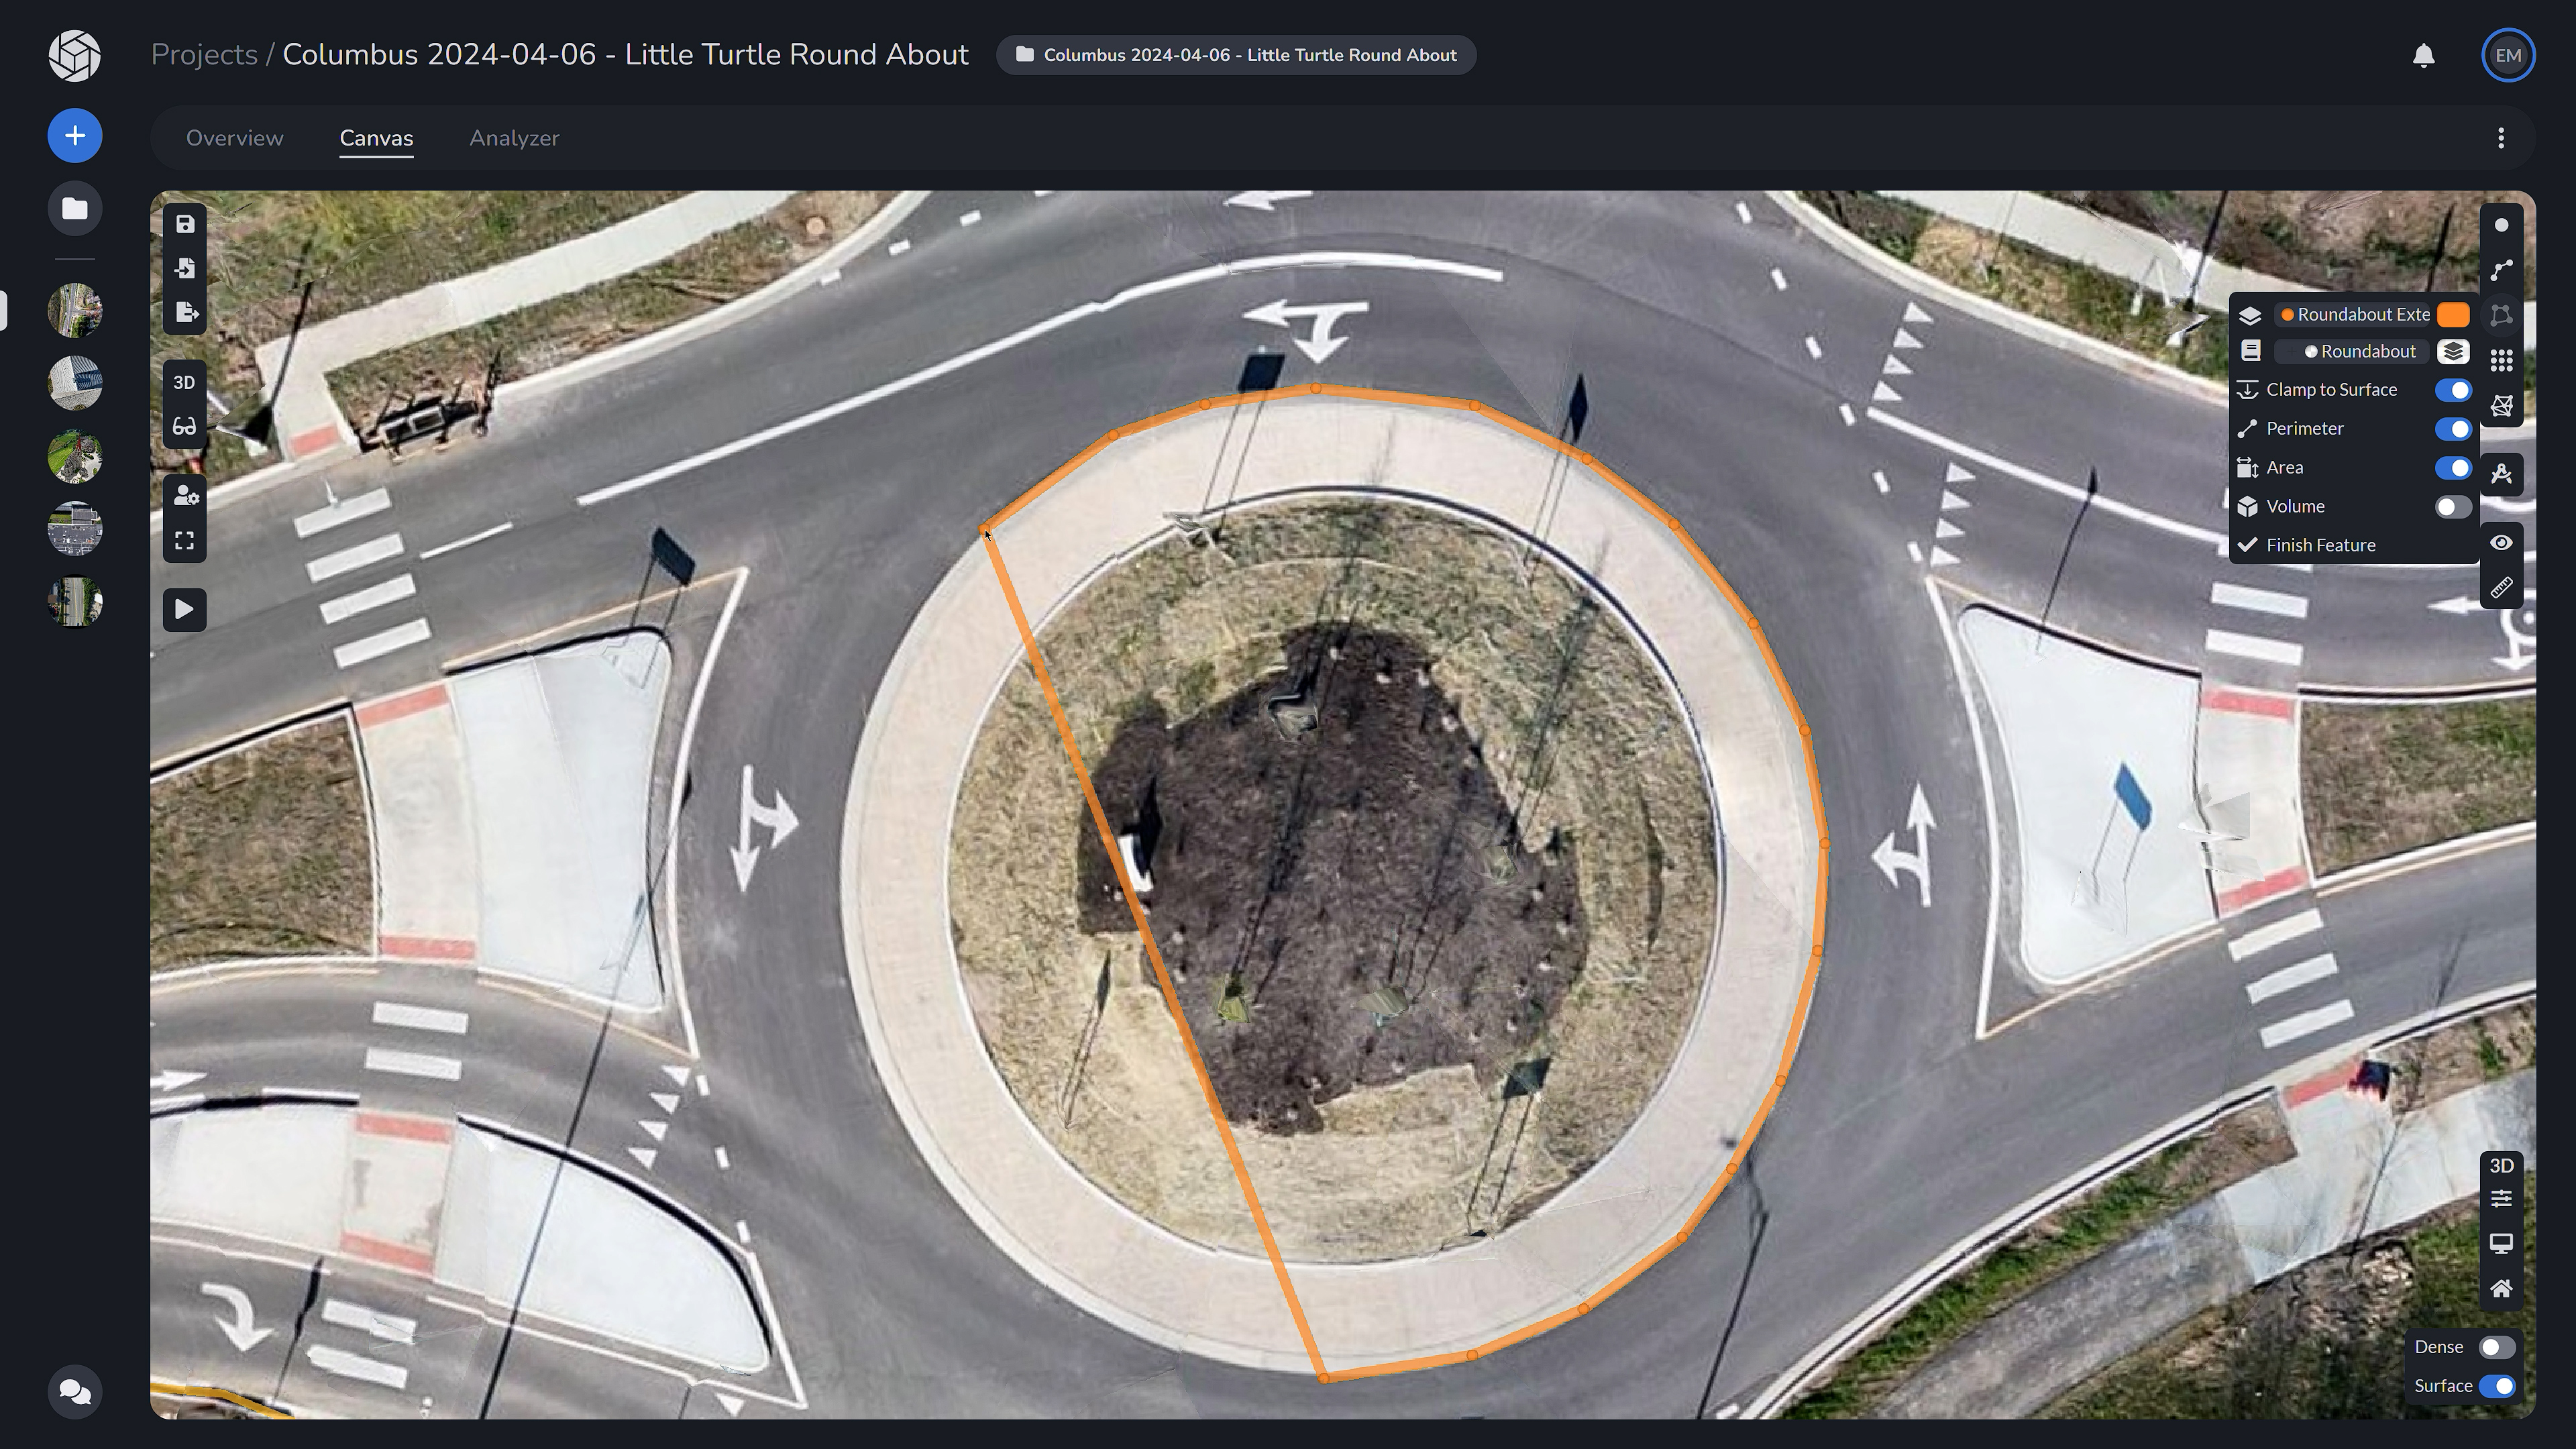
To add a polygon, you can select and label like the point and polyline. The menu also allows you to toggle to clamp the polygon to the surface, as well as toggle to display area, volume and perimeter measurements of the polygon.
A polygon is a graphical object used to represent areas or enclosed regions on a map. Polygons are used to represent areas such as land parcels, administrative boundaries, water bodies, buildings, and other spatially defined regions on a map.
Once you complete your polygon, you can select the layer from the drawing manager where you can also toggle area, volume or perimeter measurements which will display in the menu, as well as within the polygon.
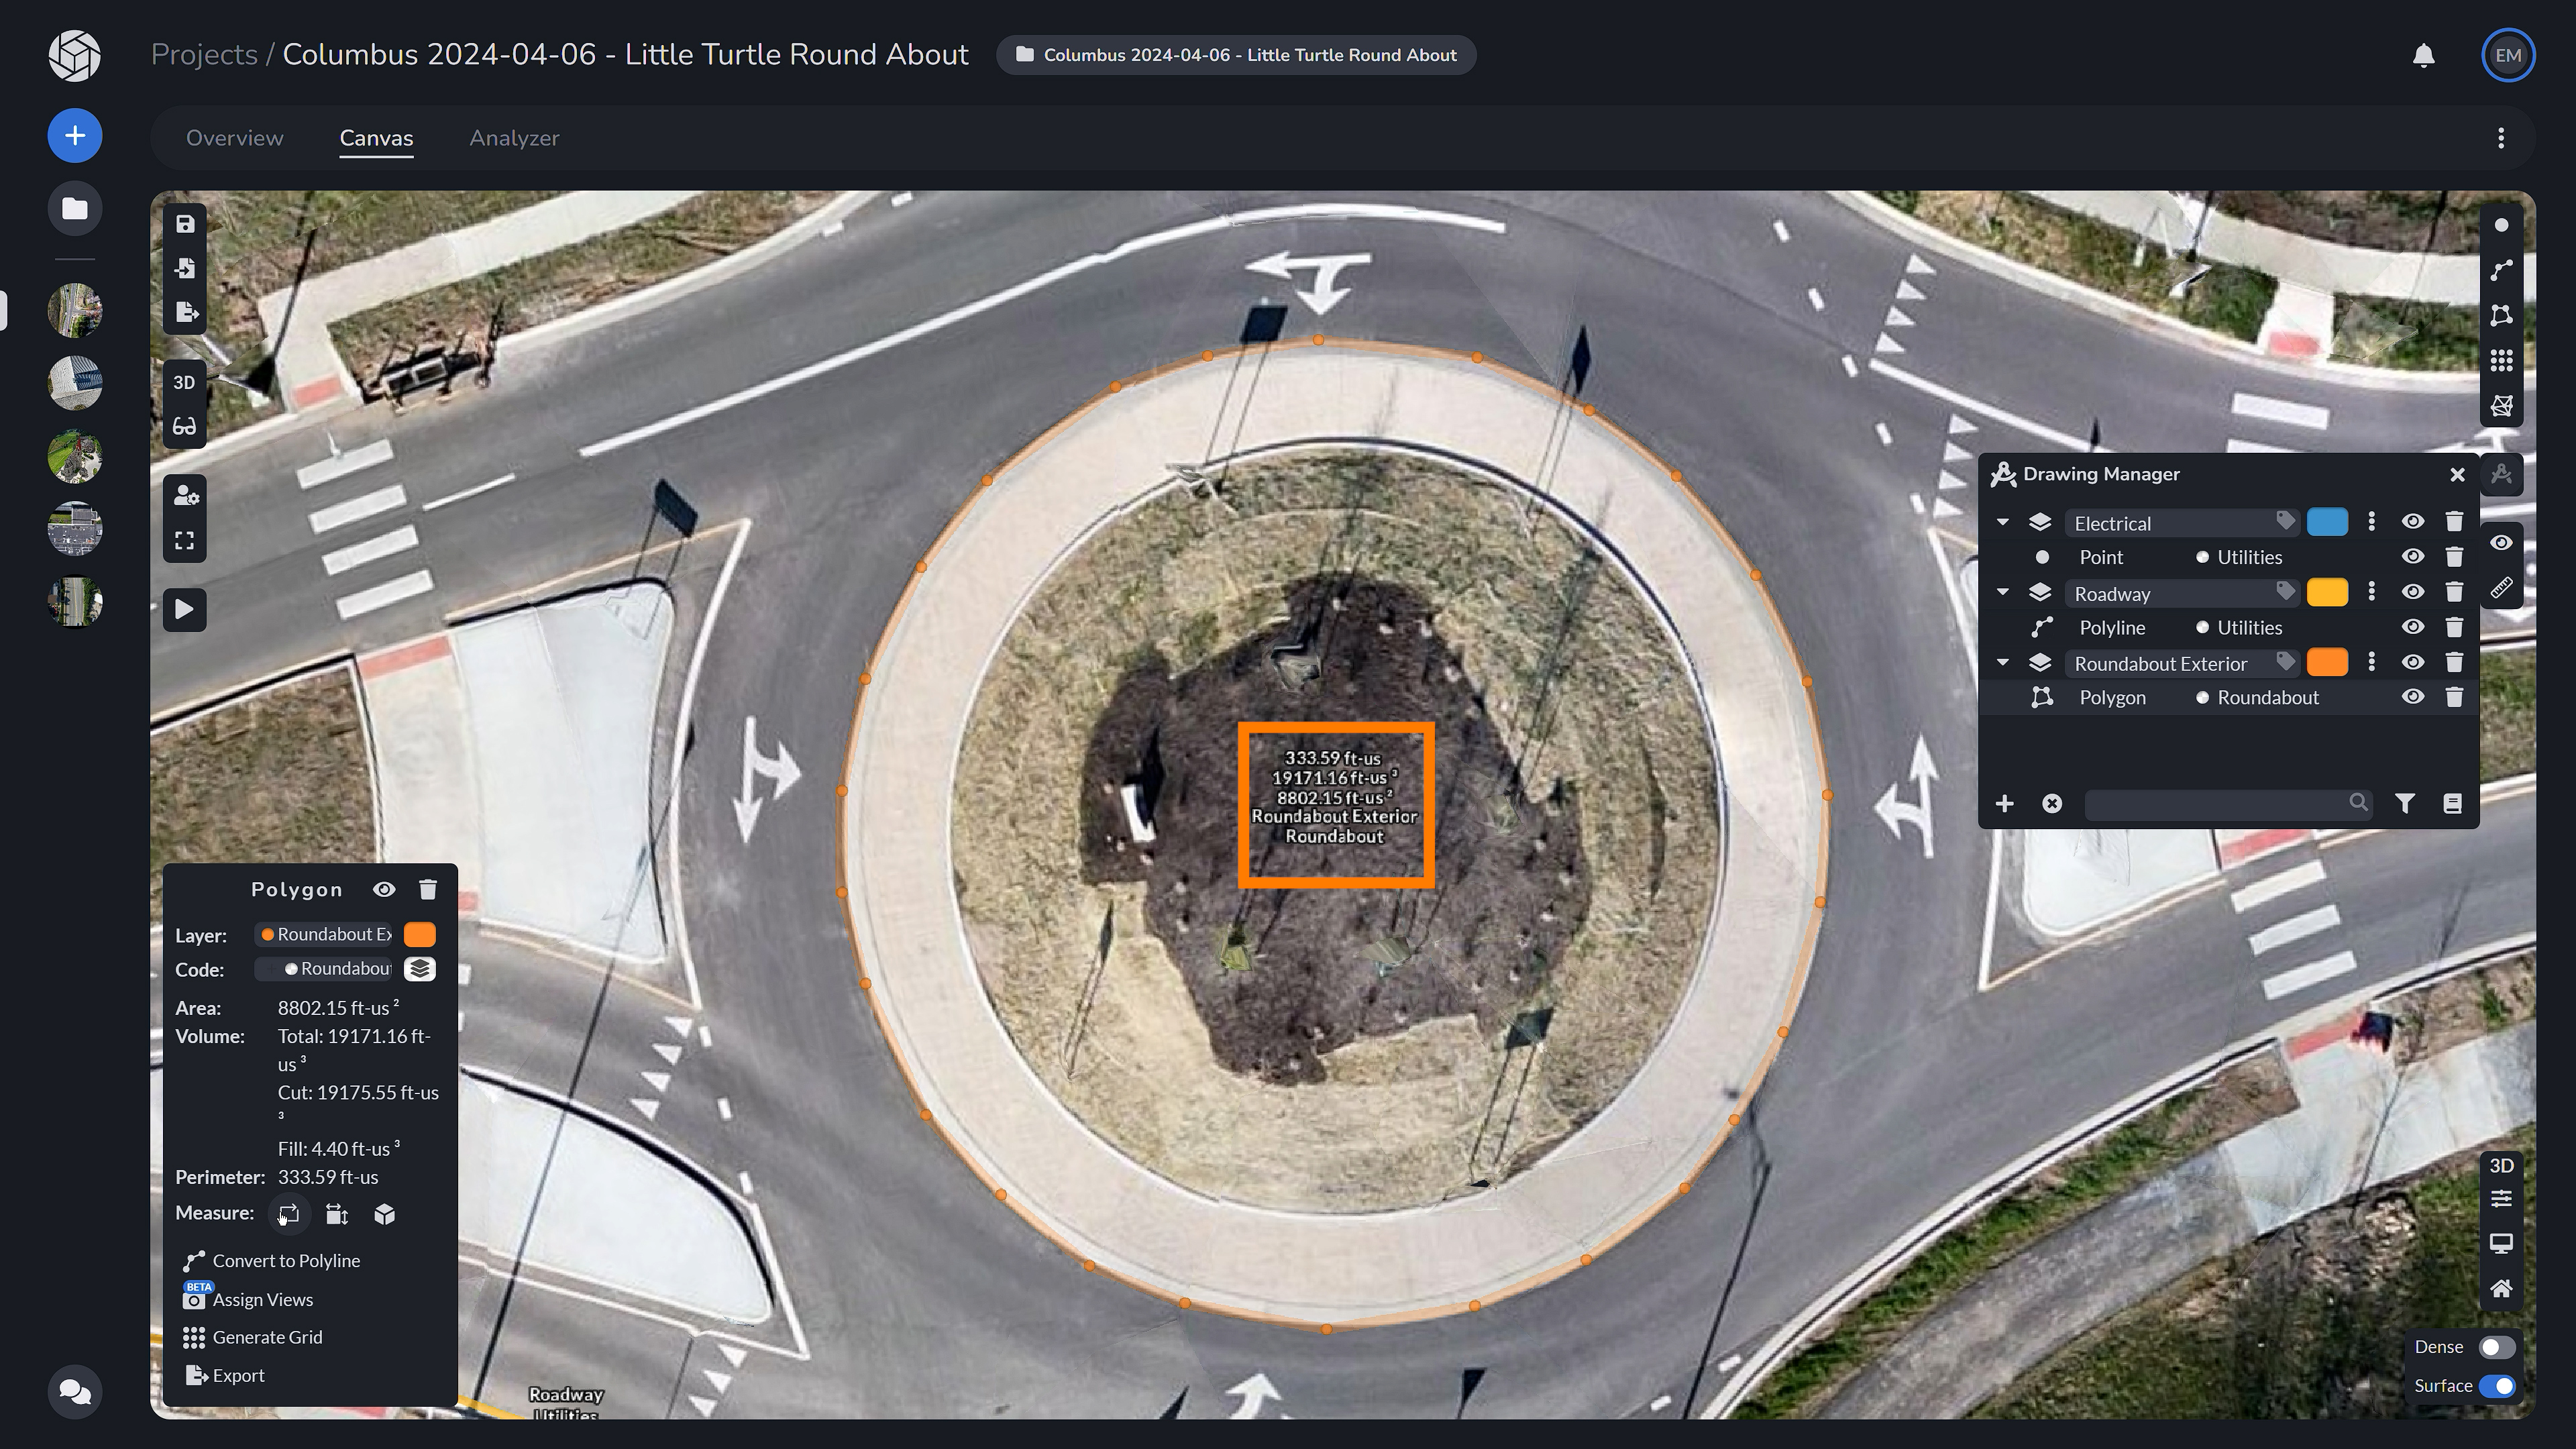
You are also able to convert the polygon to a polyline, assign views (where you would manually pick which camera view the selected polygon will use to reconstruct it in 3D), generate a grid within the polygon, as well as export.

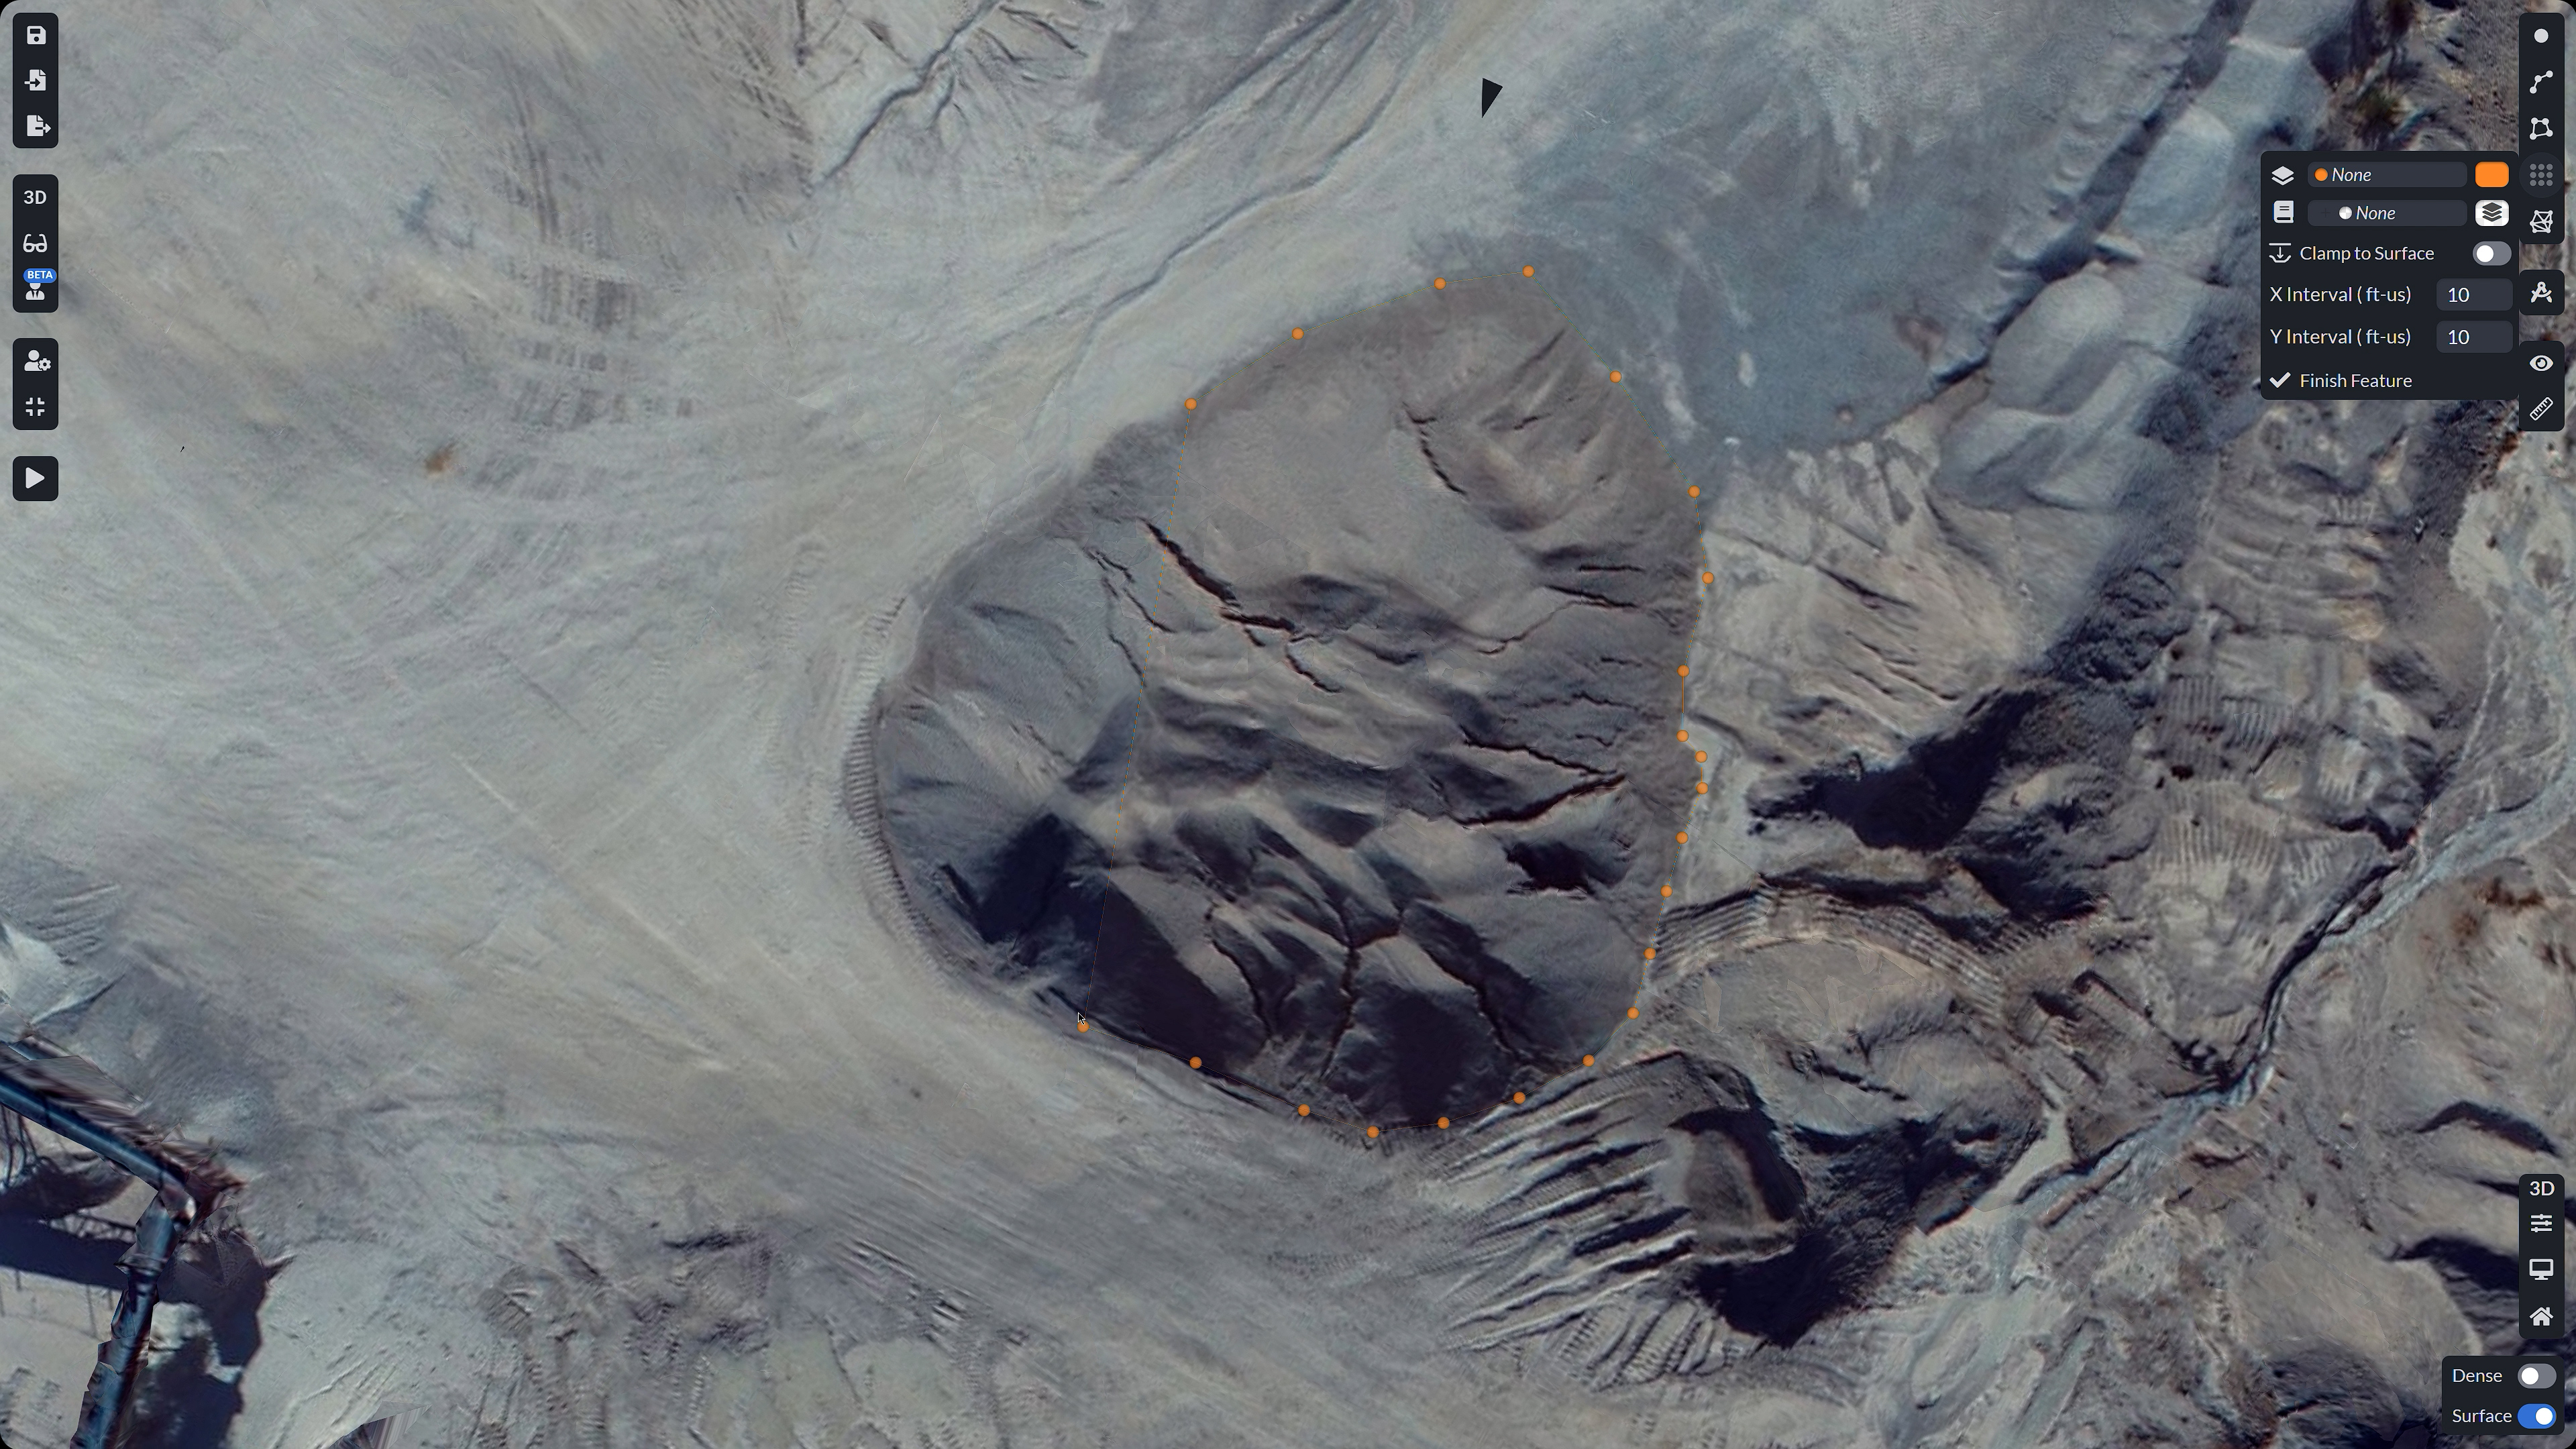
The “Generate Grid” tool is a feature that allows users to create a regular grid of points at a specific grid interval for a specific area of interest. In the menu you are able to assign a layer and code, toggle to clamp the lines drawn to the surface model, as well as set the grid intervals, which is the distance between each point on the X and Y axes of the grid.
A good example of making a grid to measure is with a stockpile. We will look at this pile and create a grid.
Upon completing your grid, you can select it from the drawing manager, and a menu will appear in the bottom left, you are able to see your layer and code labels as well as the Grid Exclude tool which is a way to remove points in your grid. Also available is the eraser, which allows you to erase points from the grid. You are able to change the radius of your eraser in the submenu.
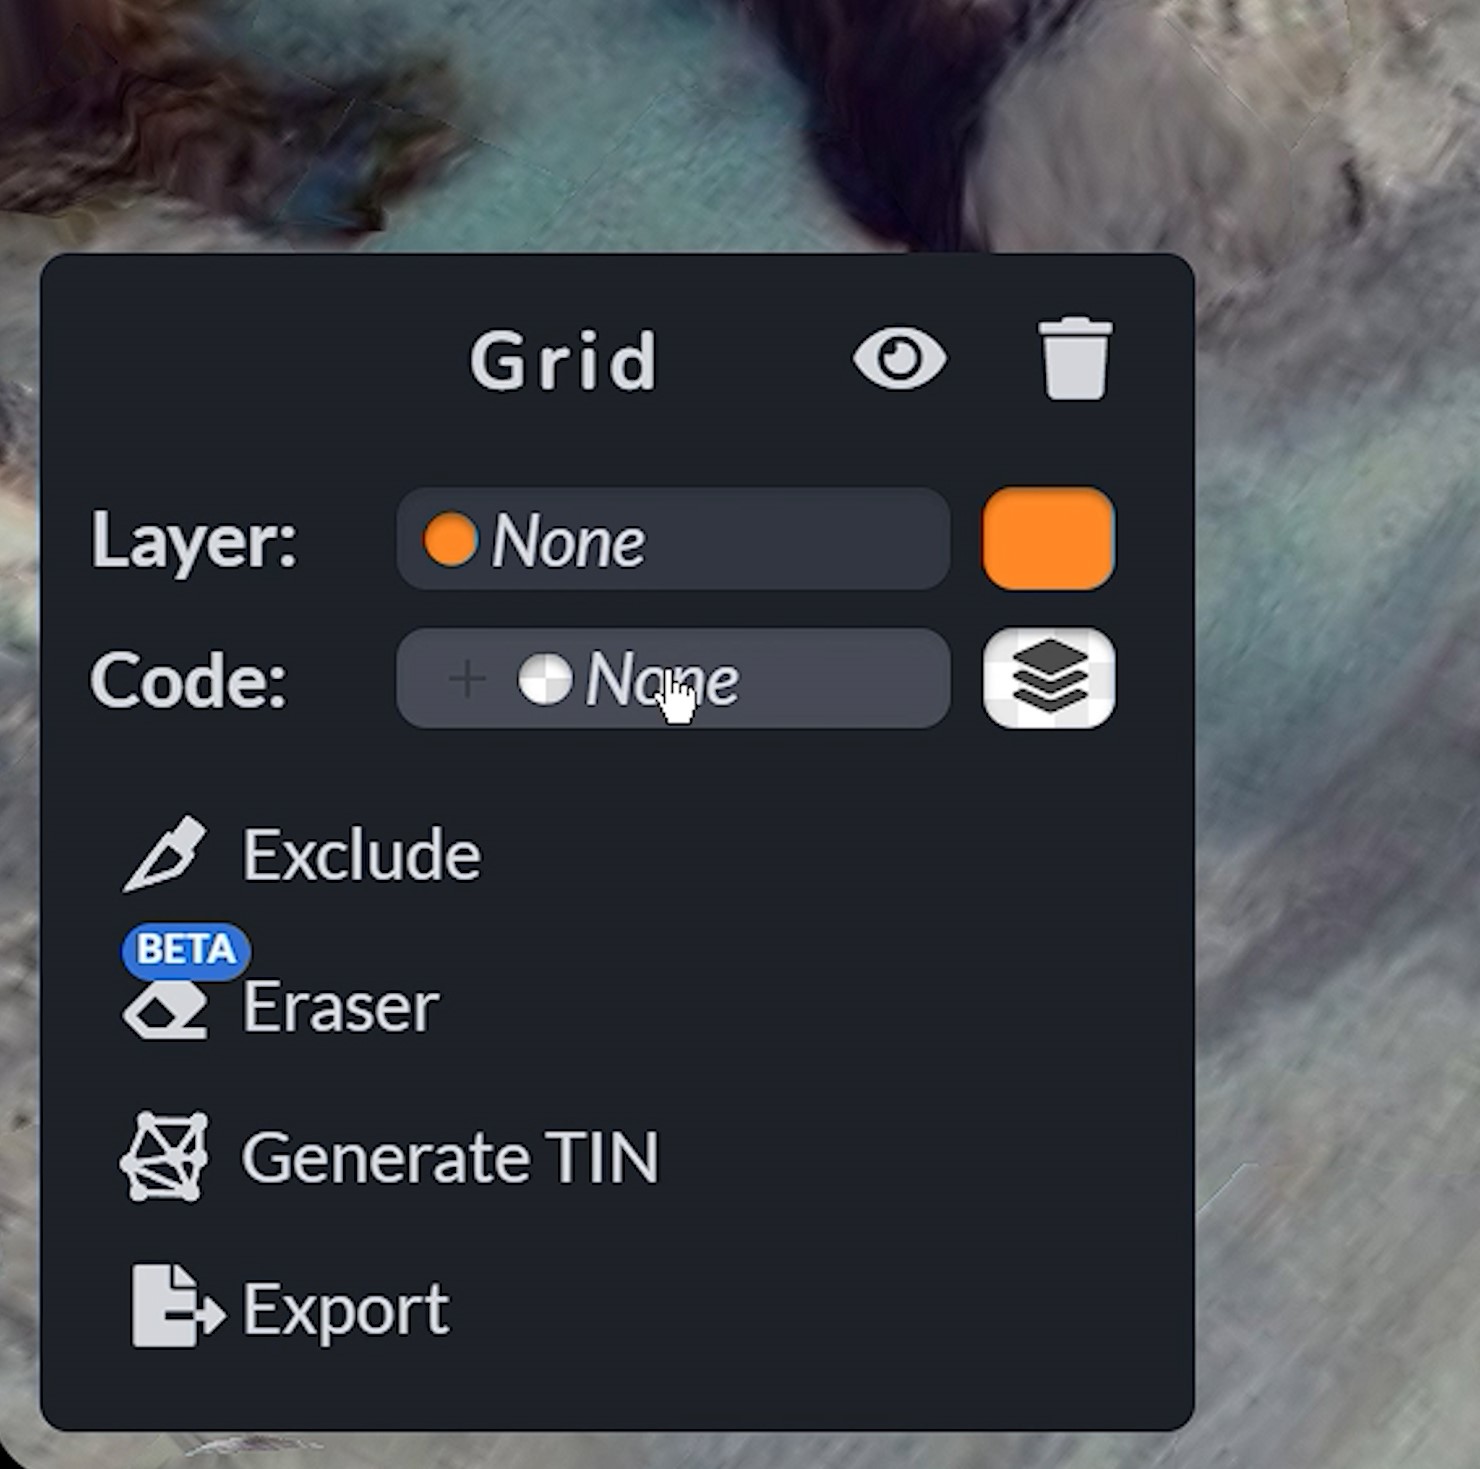
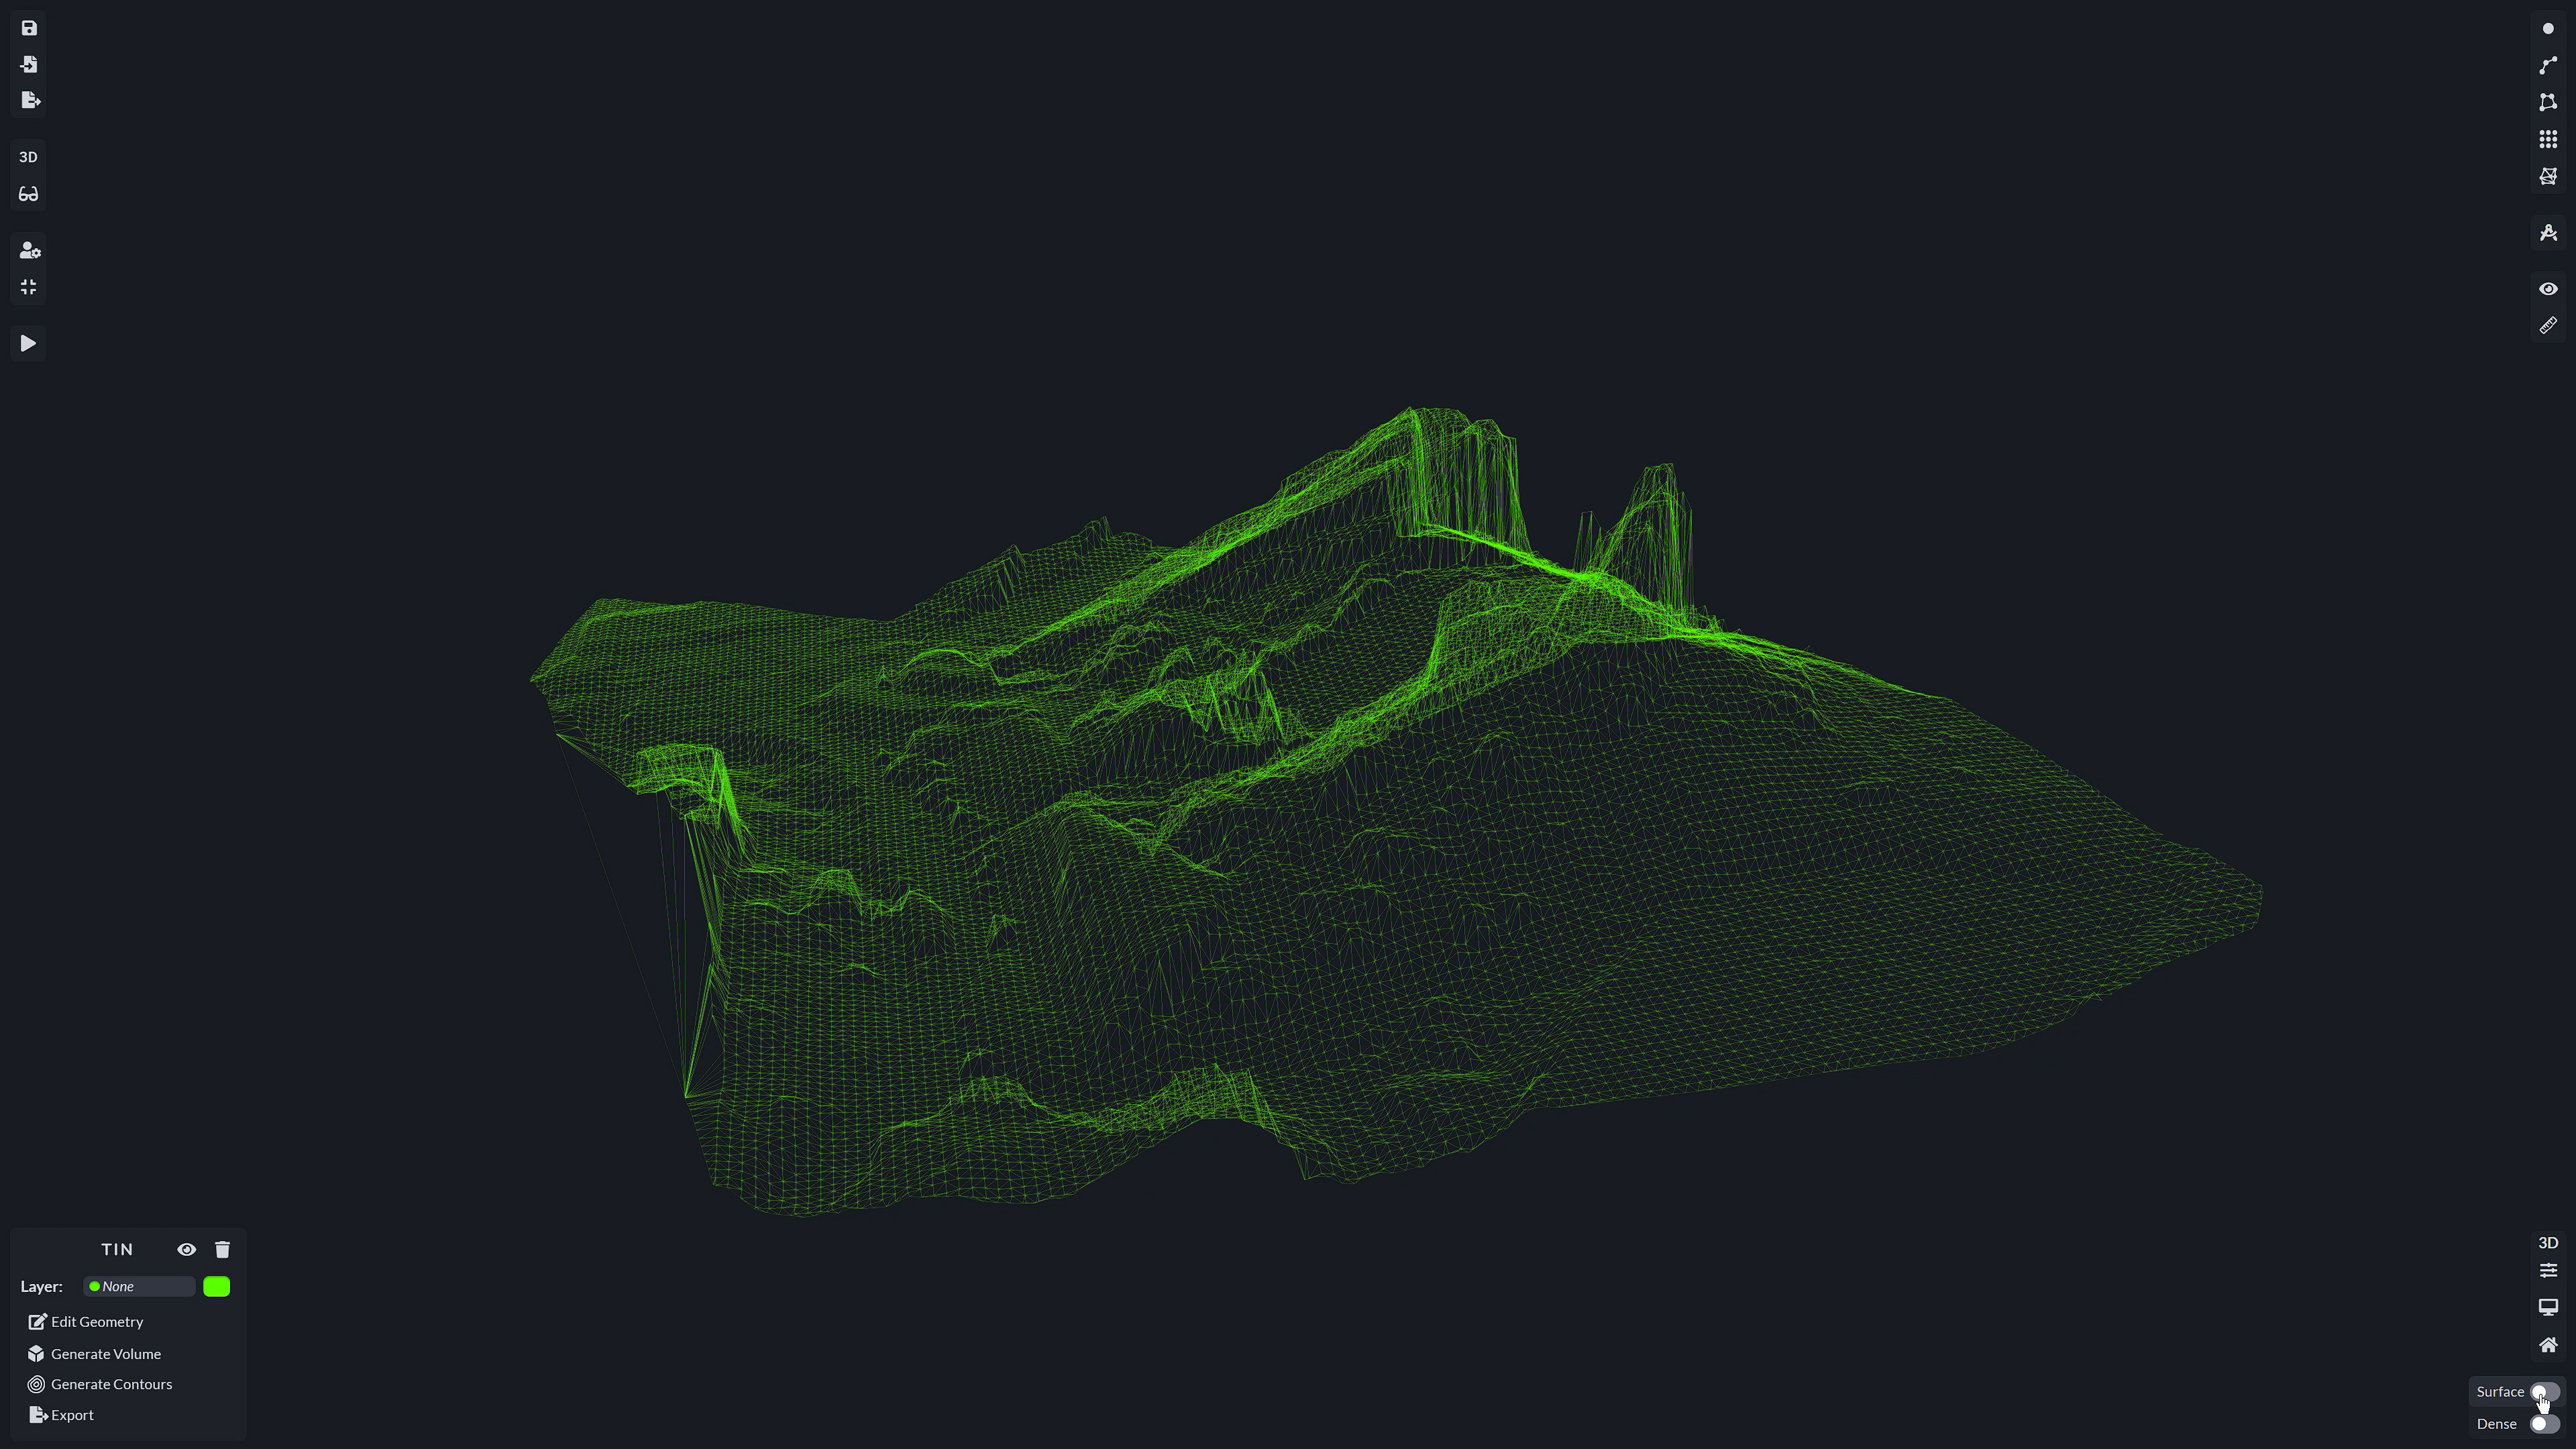
Next you are able to generate a TIN from the grid that you made. This is also the next tool in the main tool menu.

TIN stands for Triangulated Irregular Network. A TIN is a type of spatial data structure used to represent continuous surfaces, such as terrain or elevation data, as a collection of interconnected triangles. Instead of representing terrain as a regular grid (like a raster dataset) or as contours (like a vector dataset), TINs represent terrain as a collection of interconnected triangles. These sample points typically represent elevation measurements taken at specific locations. Unlike regular grids or evenly spaced contour lines, TINs can handle irregularly spaced sample points. This makes TINs suitable for representing terrain with varying levels of detail, including areas where elevation data may be sparse or unevenly distributed.
Within the TIN Menu, you are able to select whether you would like it to calculate a TIN of the bare earth, which is of your entire map, or from a selection.
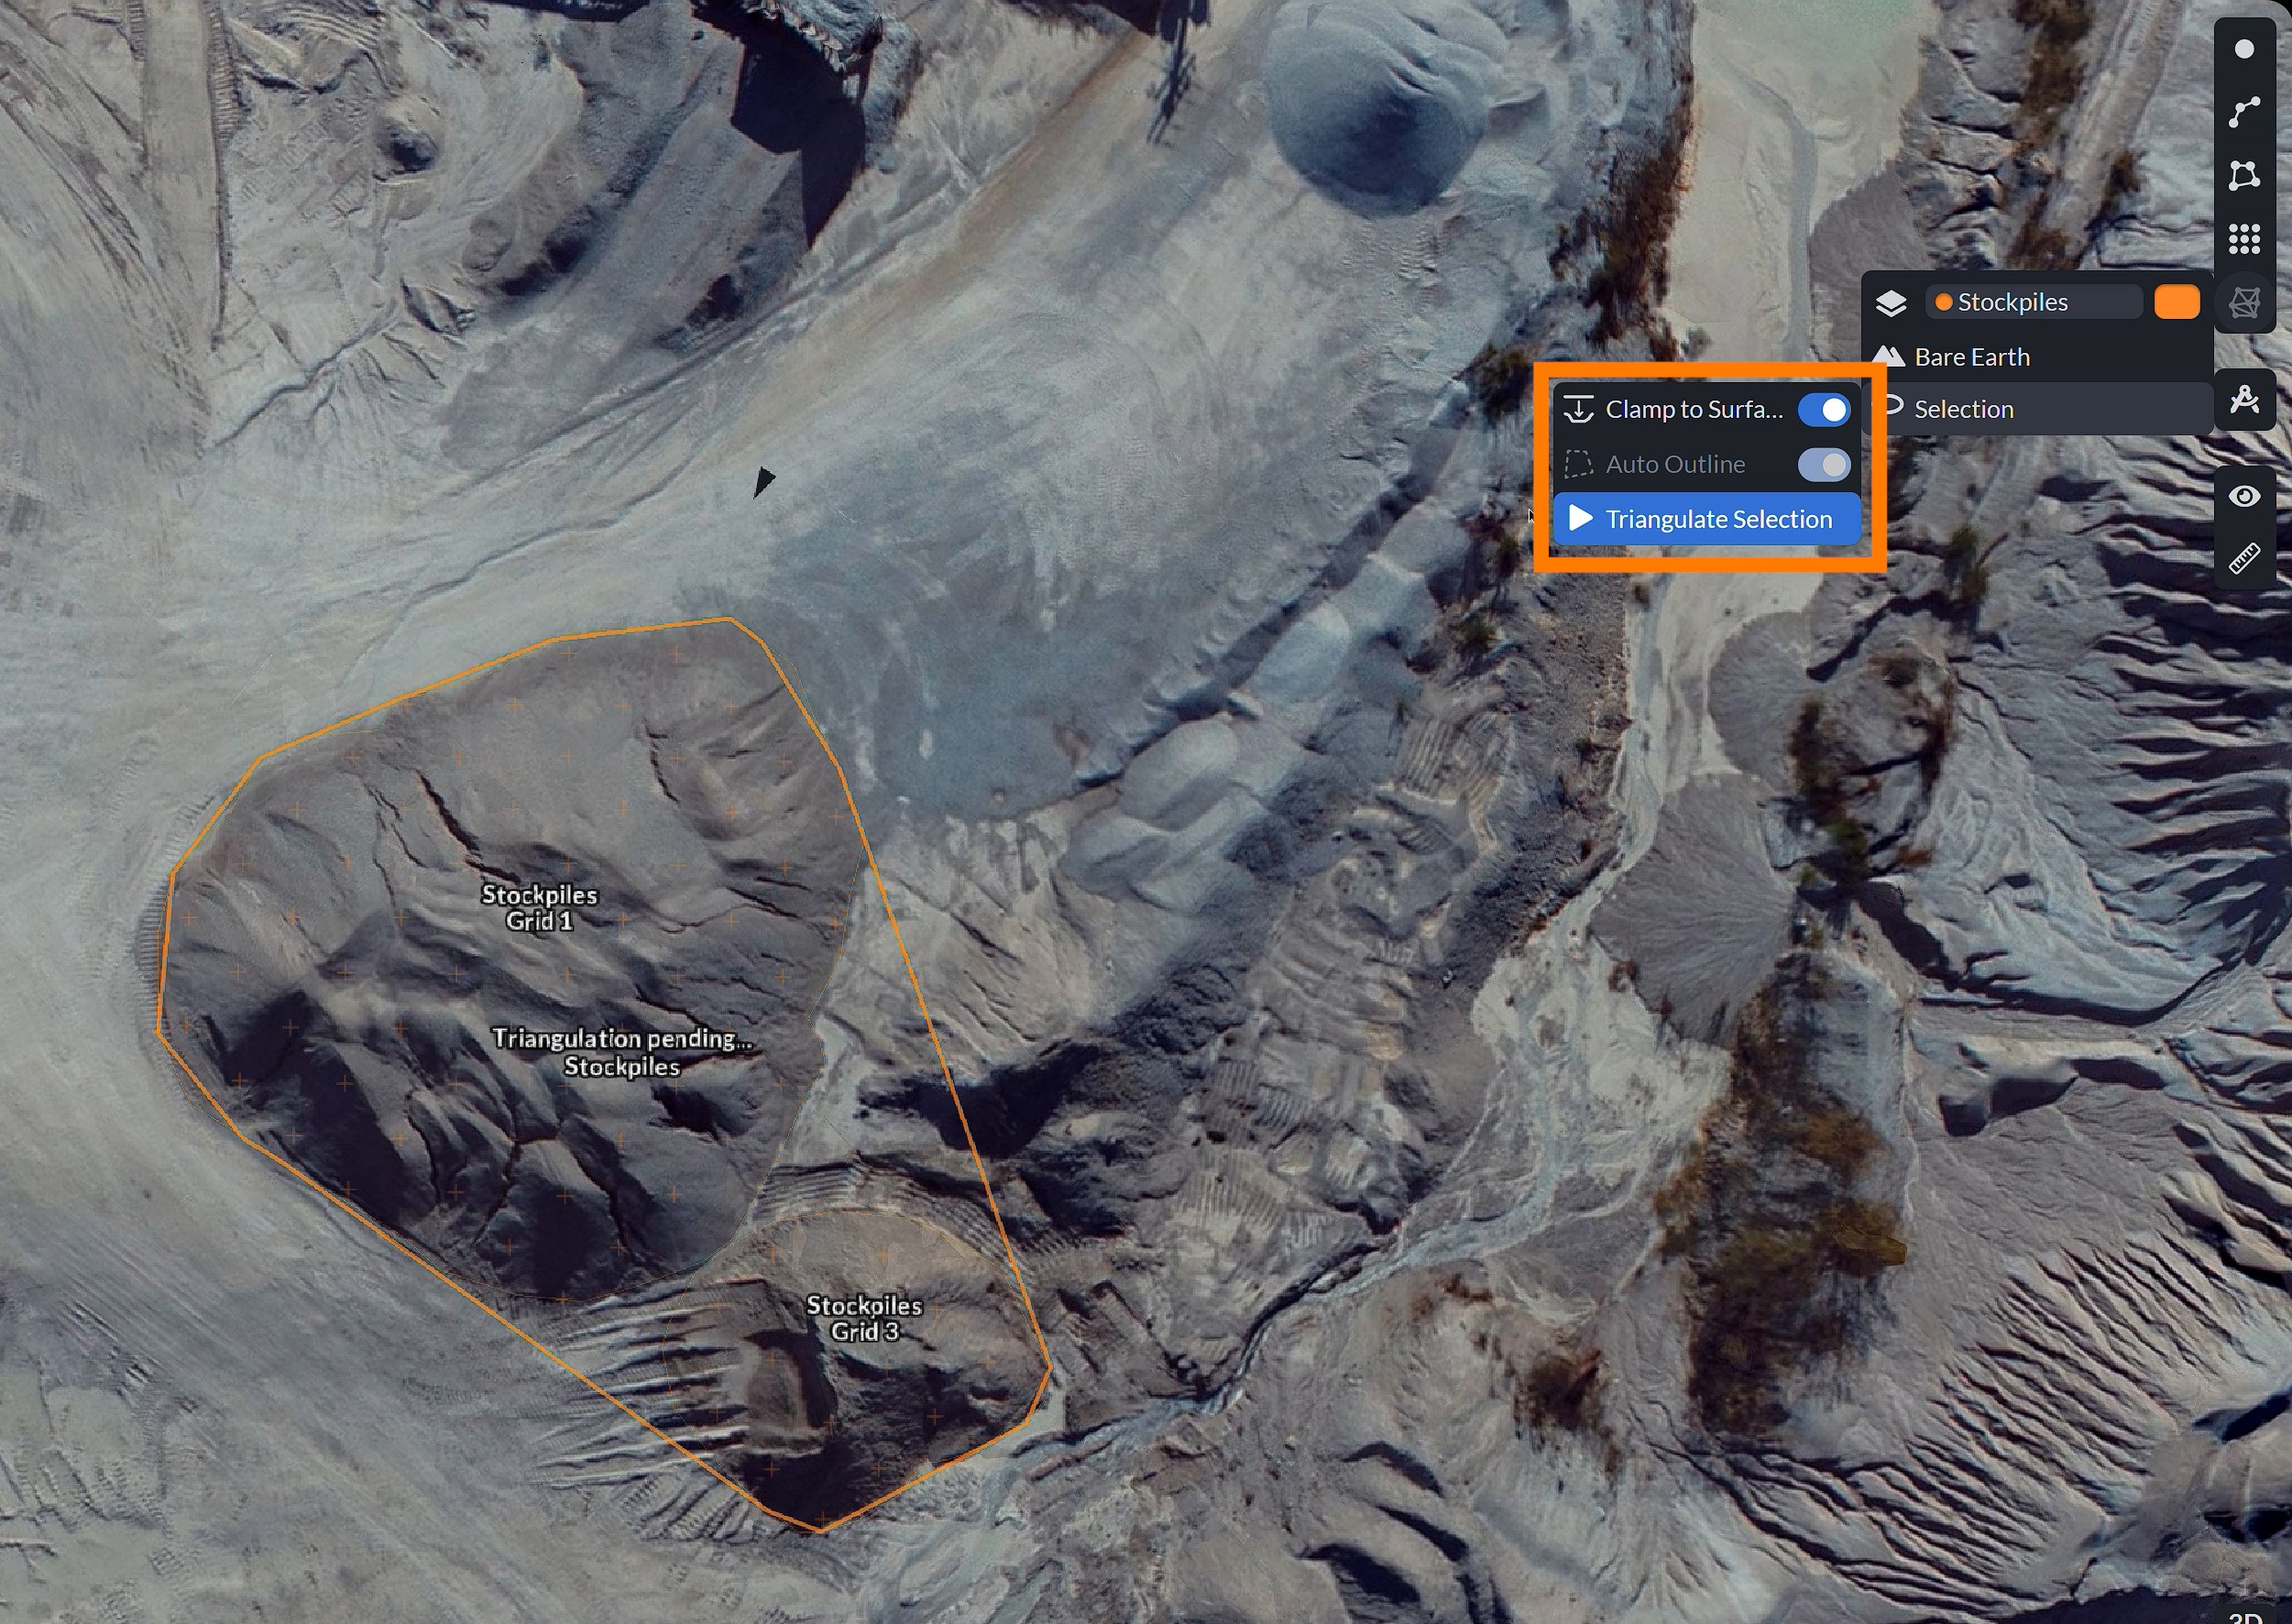
Within the selection menu, you are able to draw a polygon around a certain feature. This may be useful when wanting to only create a TIN for a certain part of a feature. Toggling the auto outline, allows you to select already created features, like a grid, by just clicking on the area. A list of your selections will accumulate on the bottom left, when you have everything selected, you may hit generate automatic outline, and then, triangulate section.
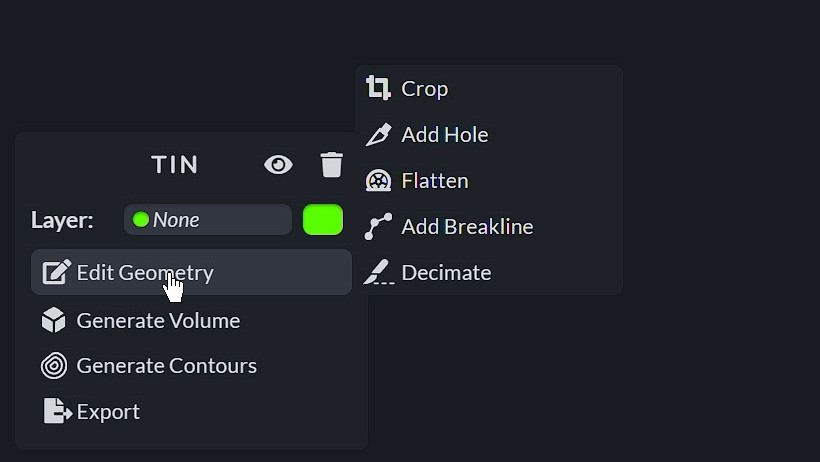
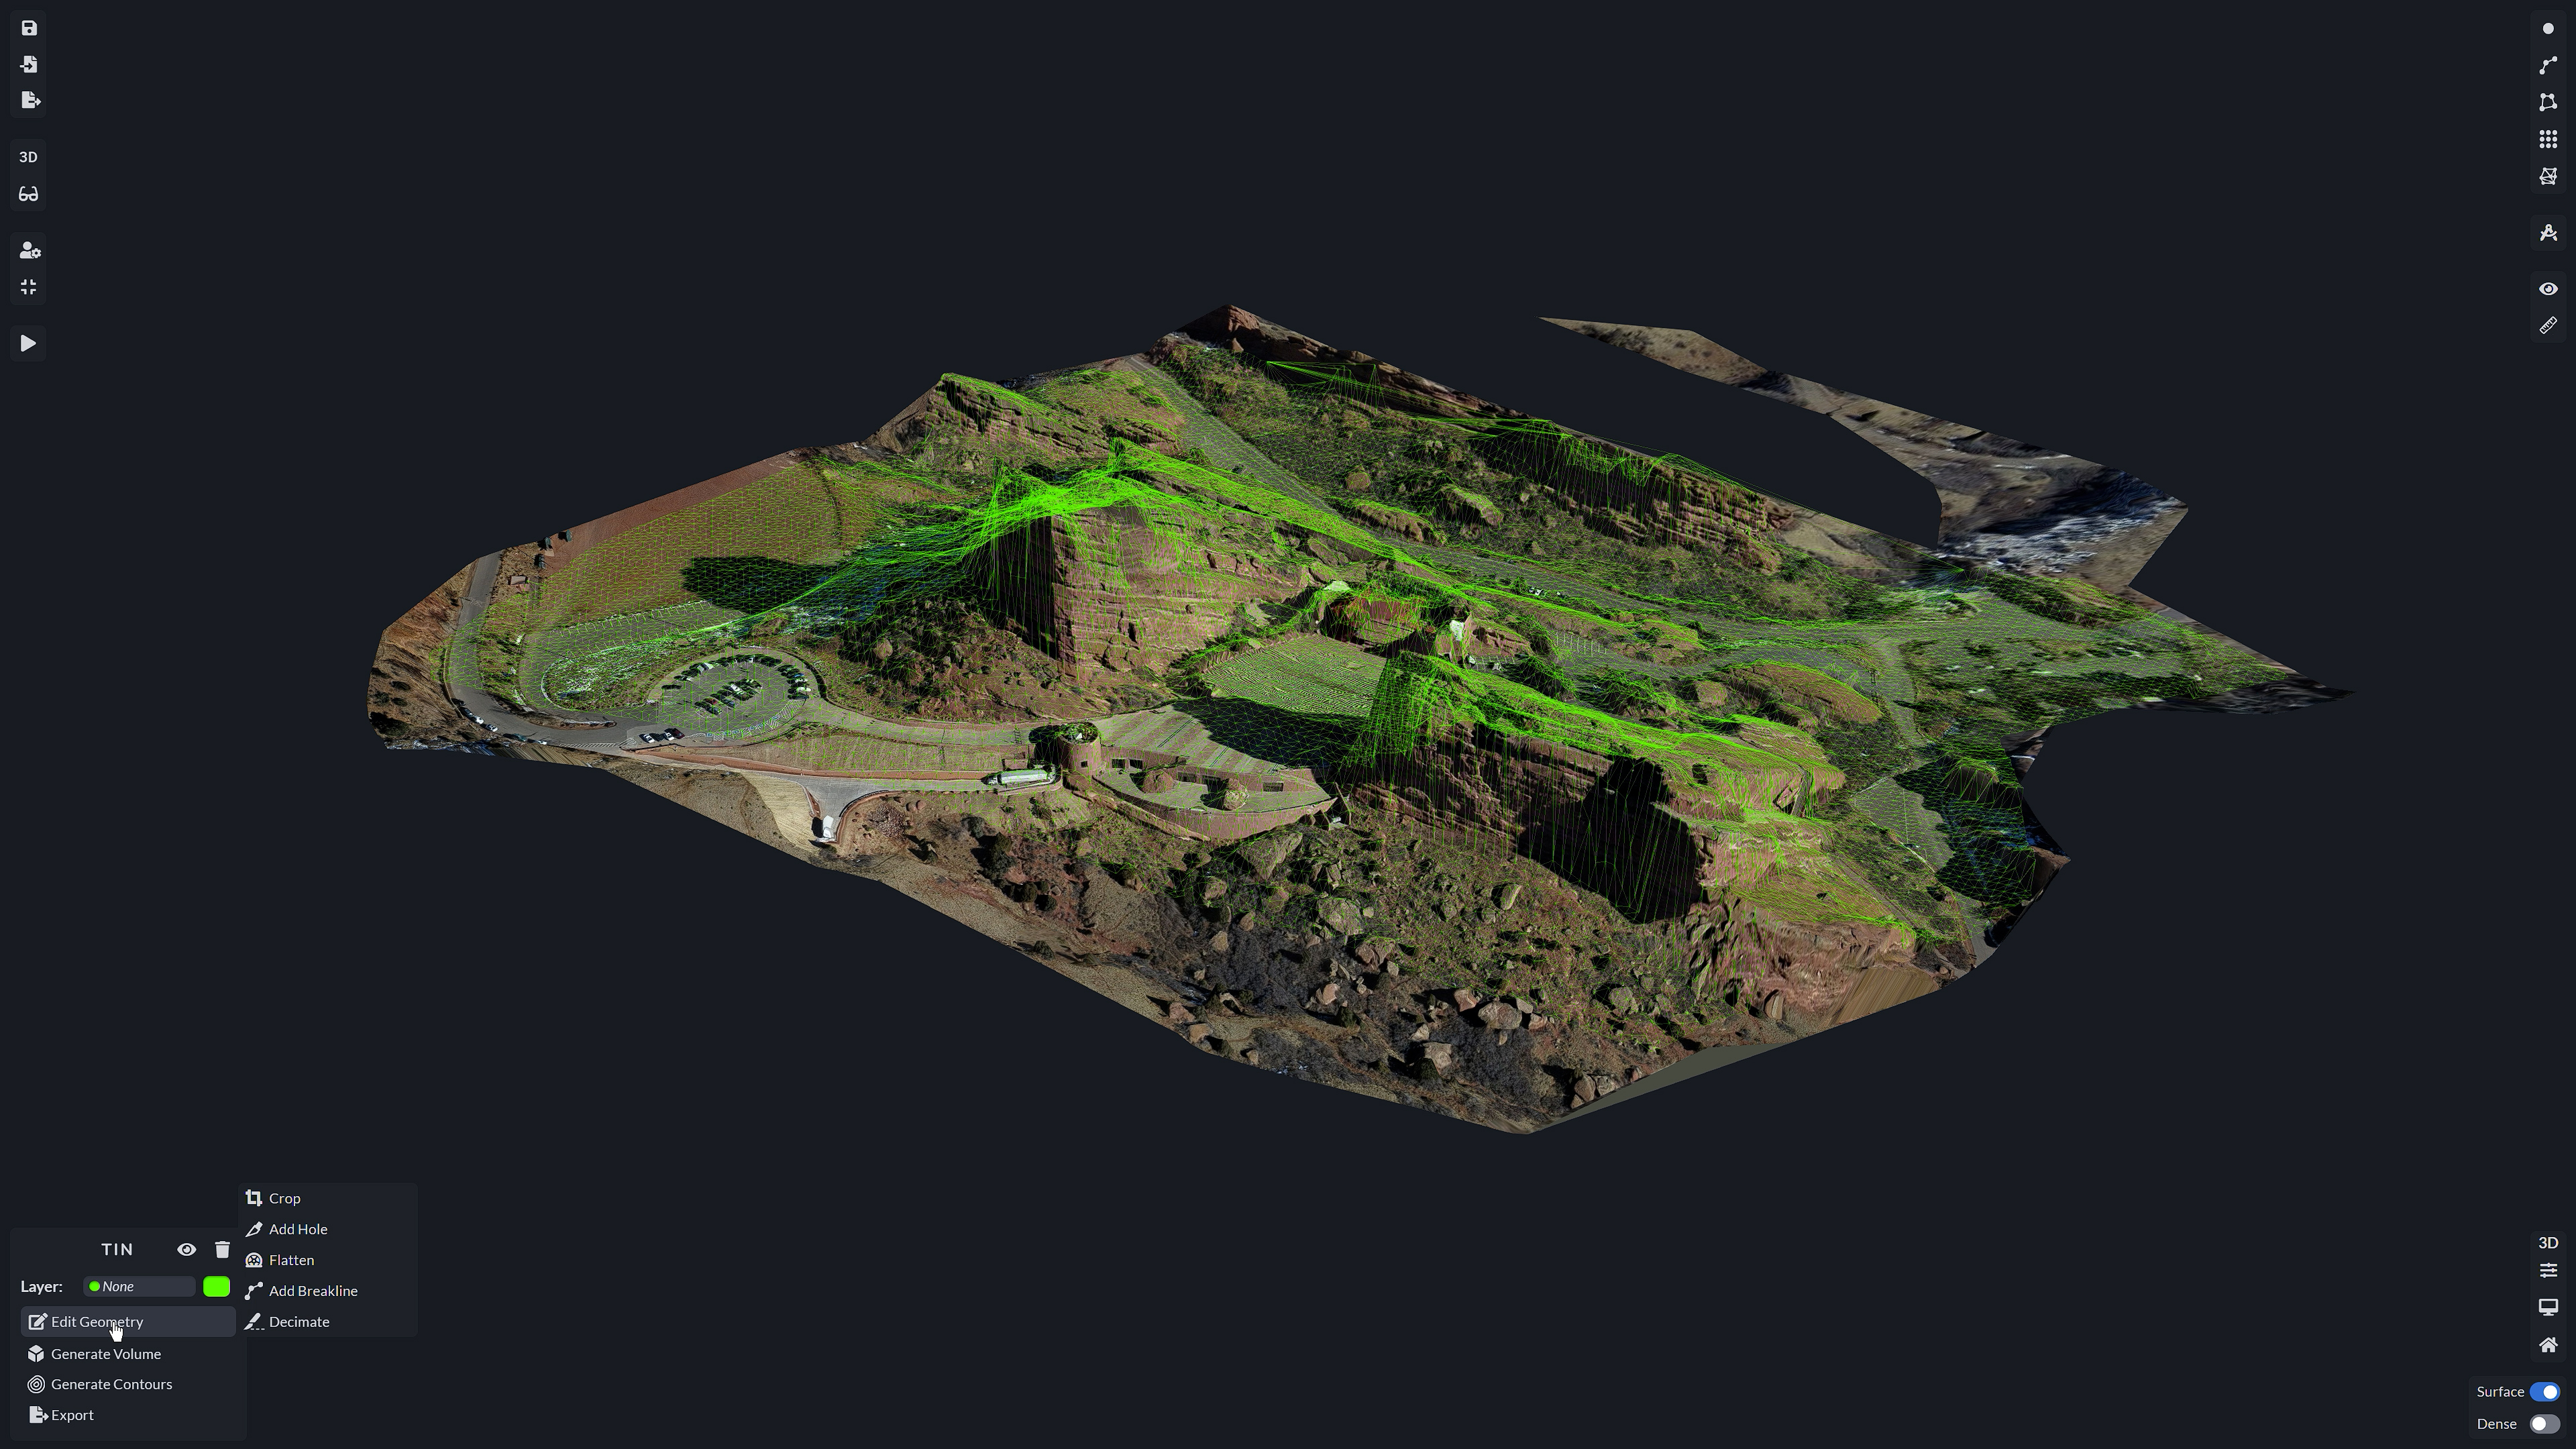
Within the TIN menu, you are able to edit the Geometry of the TIN, by cropping the boundary region around the TIN, add a hole, if you would like to deselect an area that is located within the TIN’s boundaries, flatten an area within the TIN, add a breakline, which creates a hard edge in the TIN and is used to define abrupt changes in the terrain surface, typically used to represent features such as ridges, valleys, cliffs or other significant changes in slope that cannot be accurately captured by the irregularly spaced vertices of the TIN triangles alone, and decimate, which controls the percentage of triangles that would be removed from the TIN.
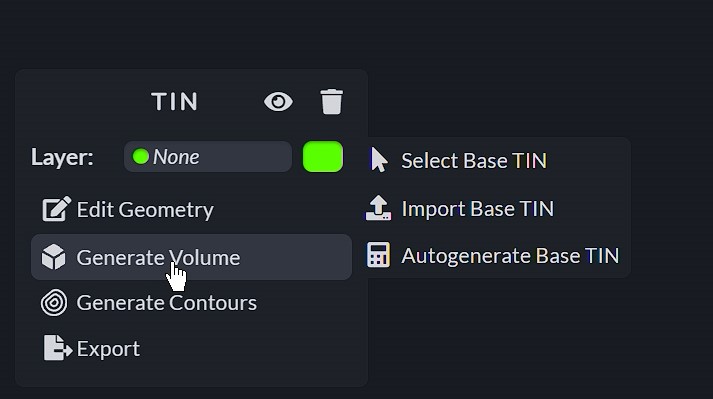
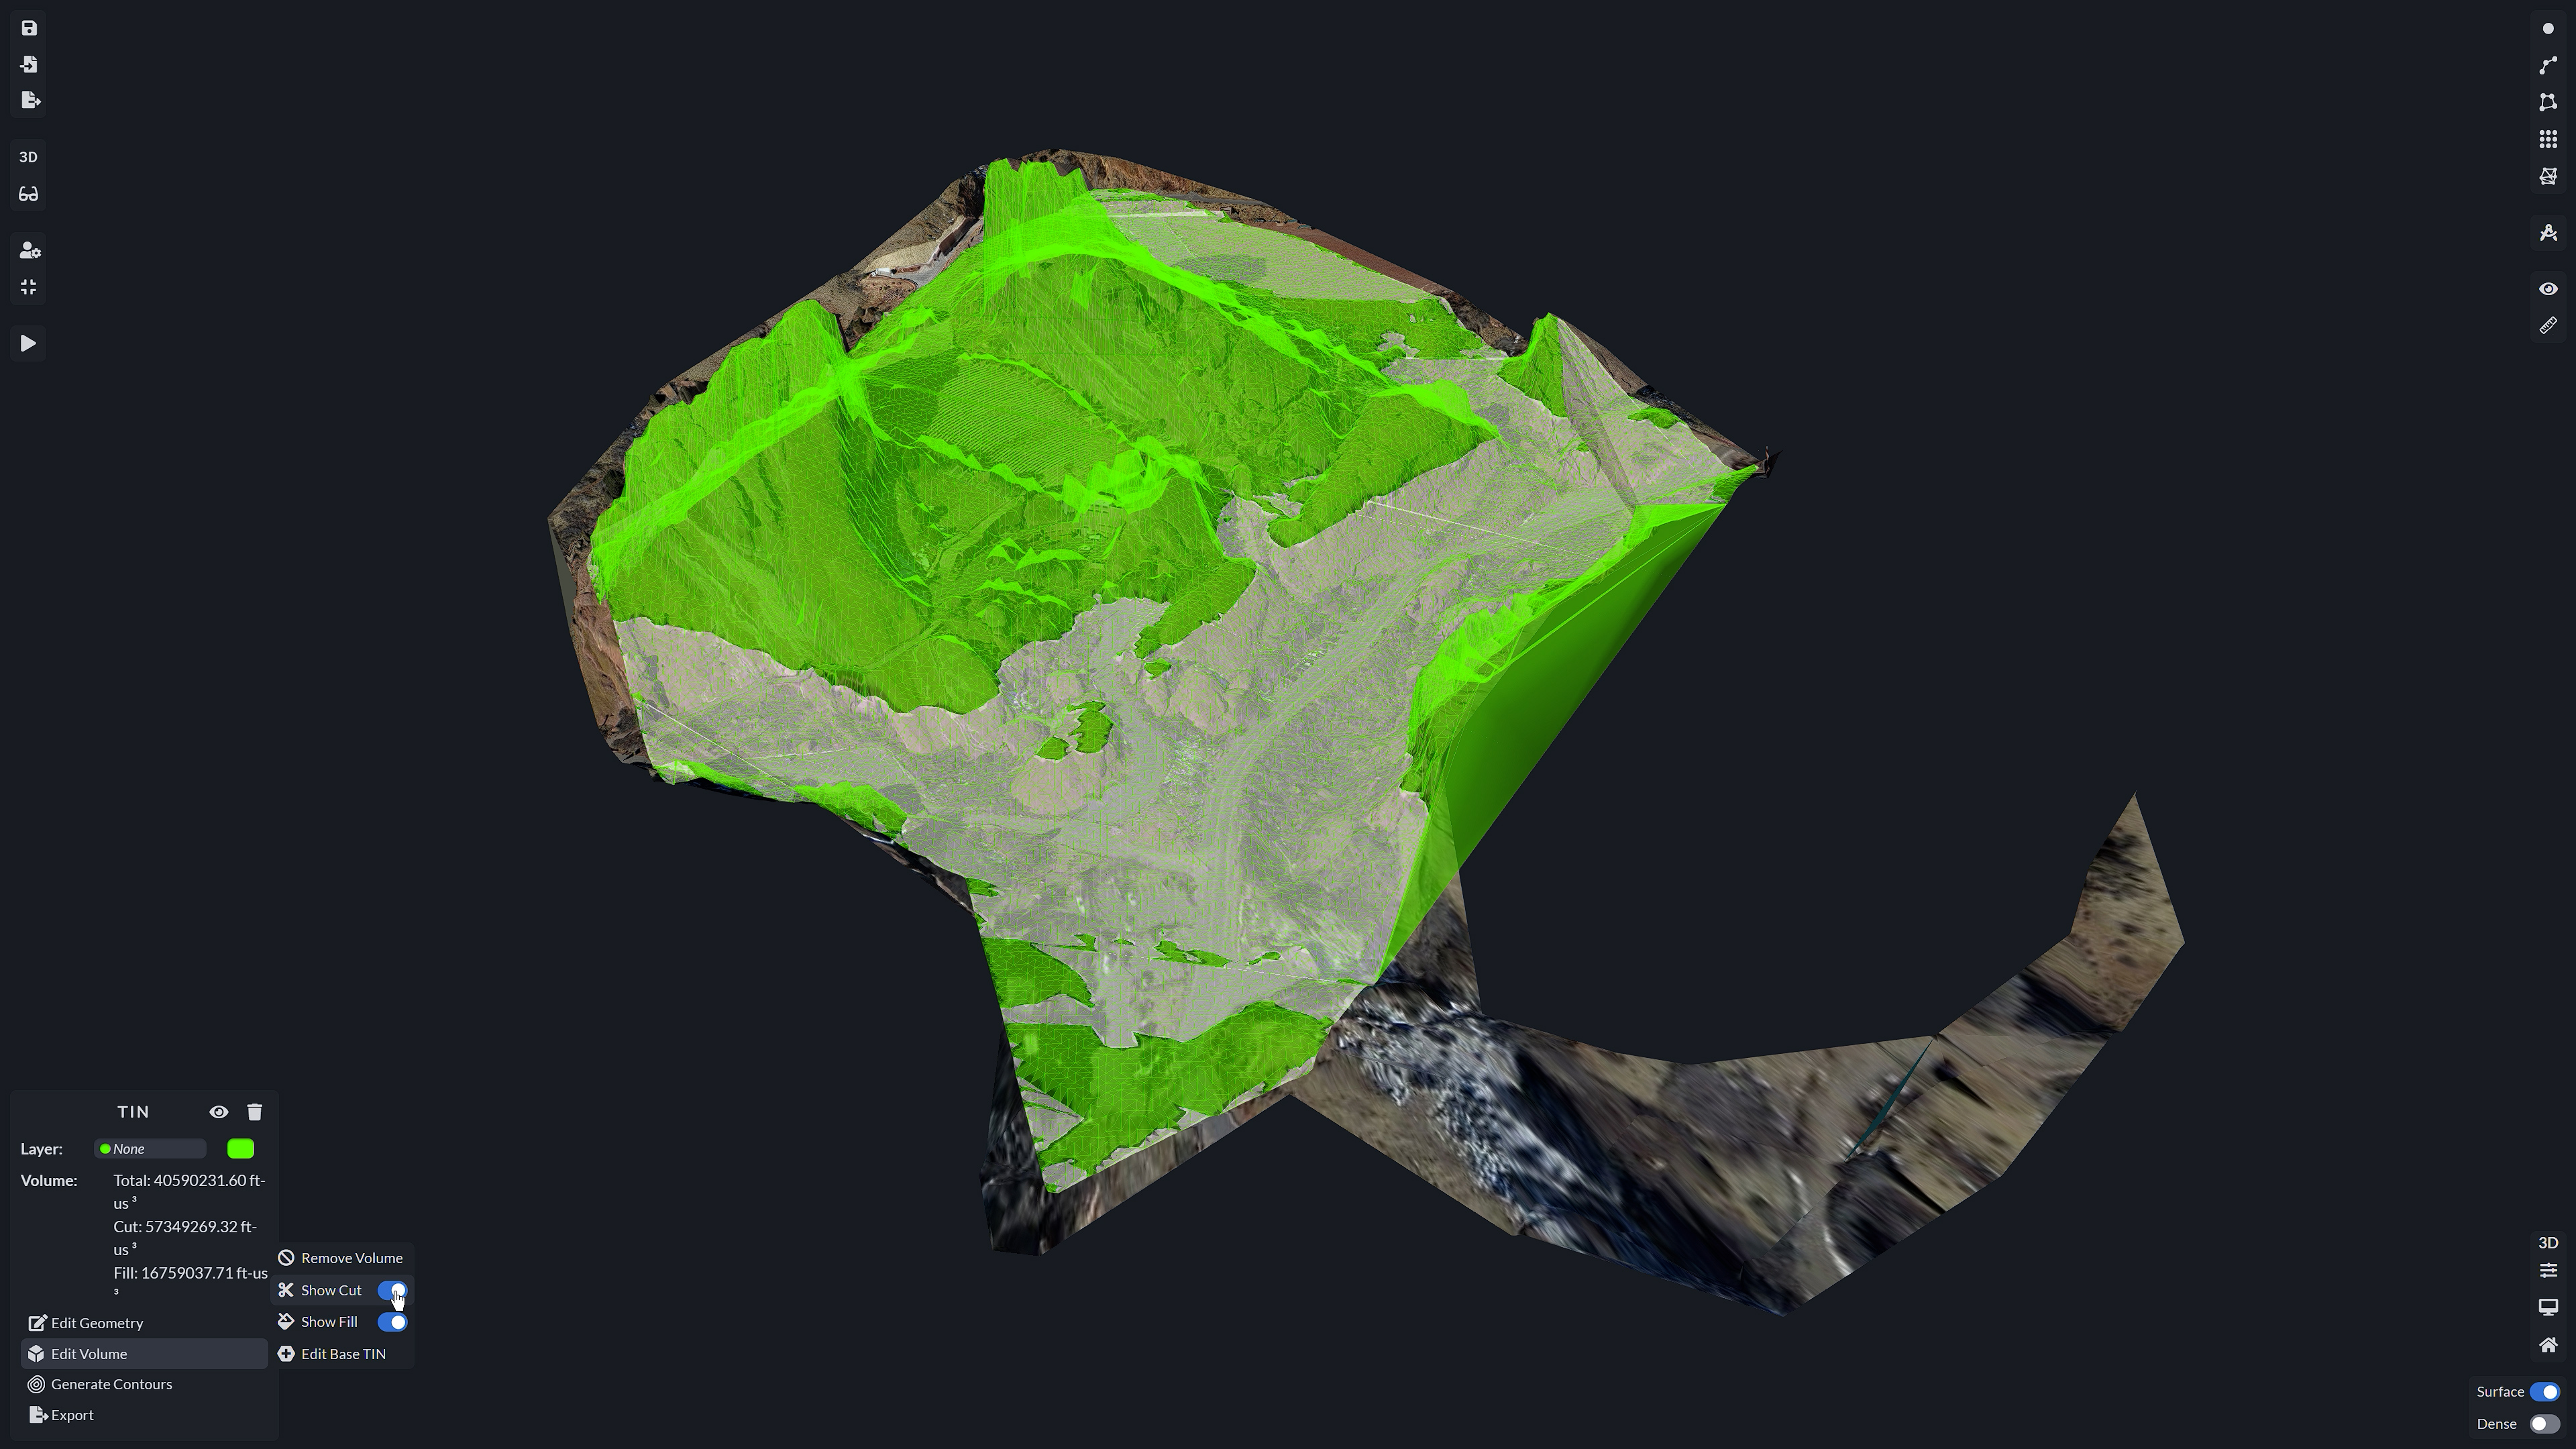
Next is Generate Volume where you can select a base TIN in the drawing to compute a new volume against. You are also able to import a base TIN and auto-generate a base TIN. Upon calculating a base tin, you are provided with a detailed analysis of the volume difference between the base TIN and the current terrain surface. This analysis typically includes information such as the volume of material to be excavated or filled, as well as the area of cut and fill. This data is essential for earthwork projects, construction planning, and land development activities as it helps stakeholders understand the scope of the terrain modifications required and to estimate associated costs accurately.

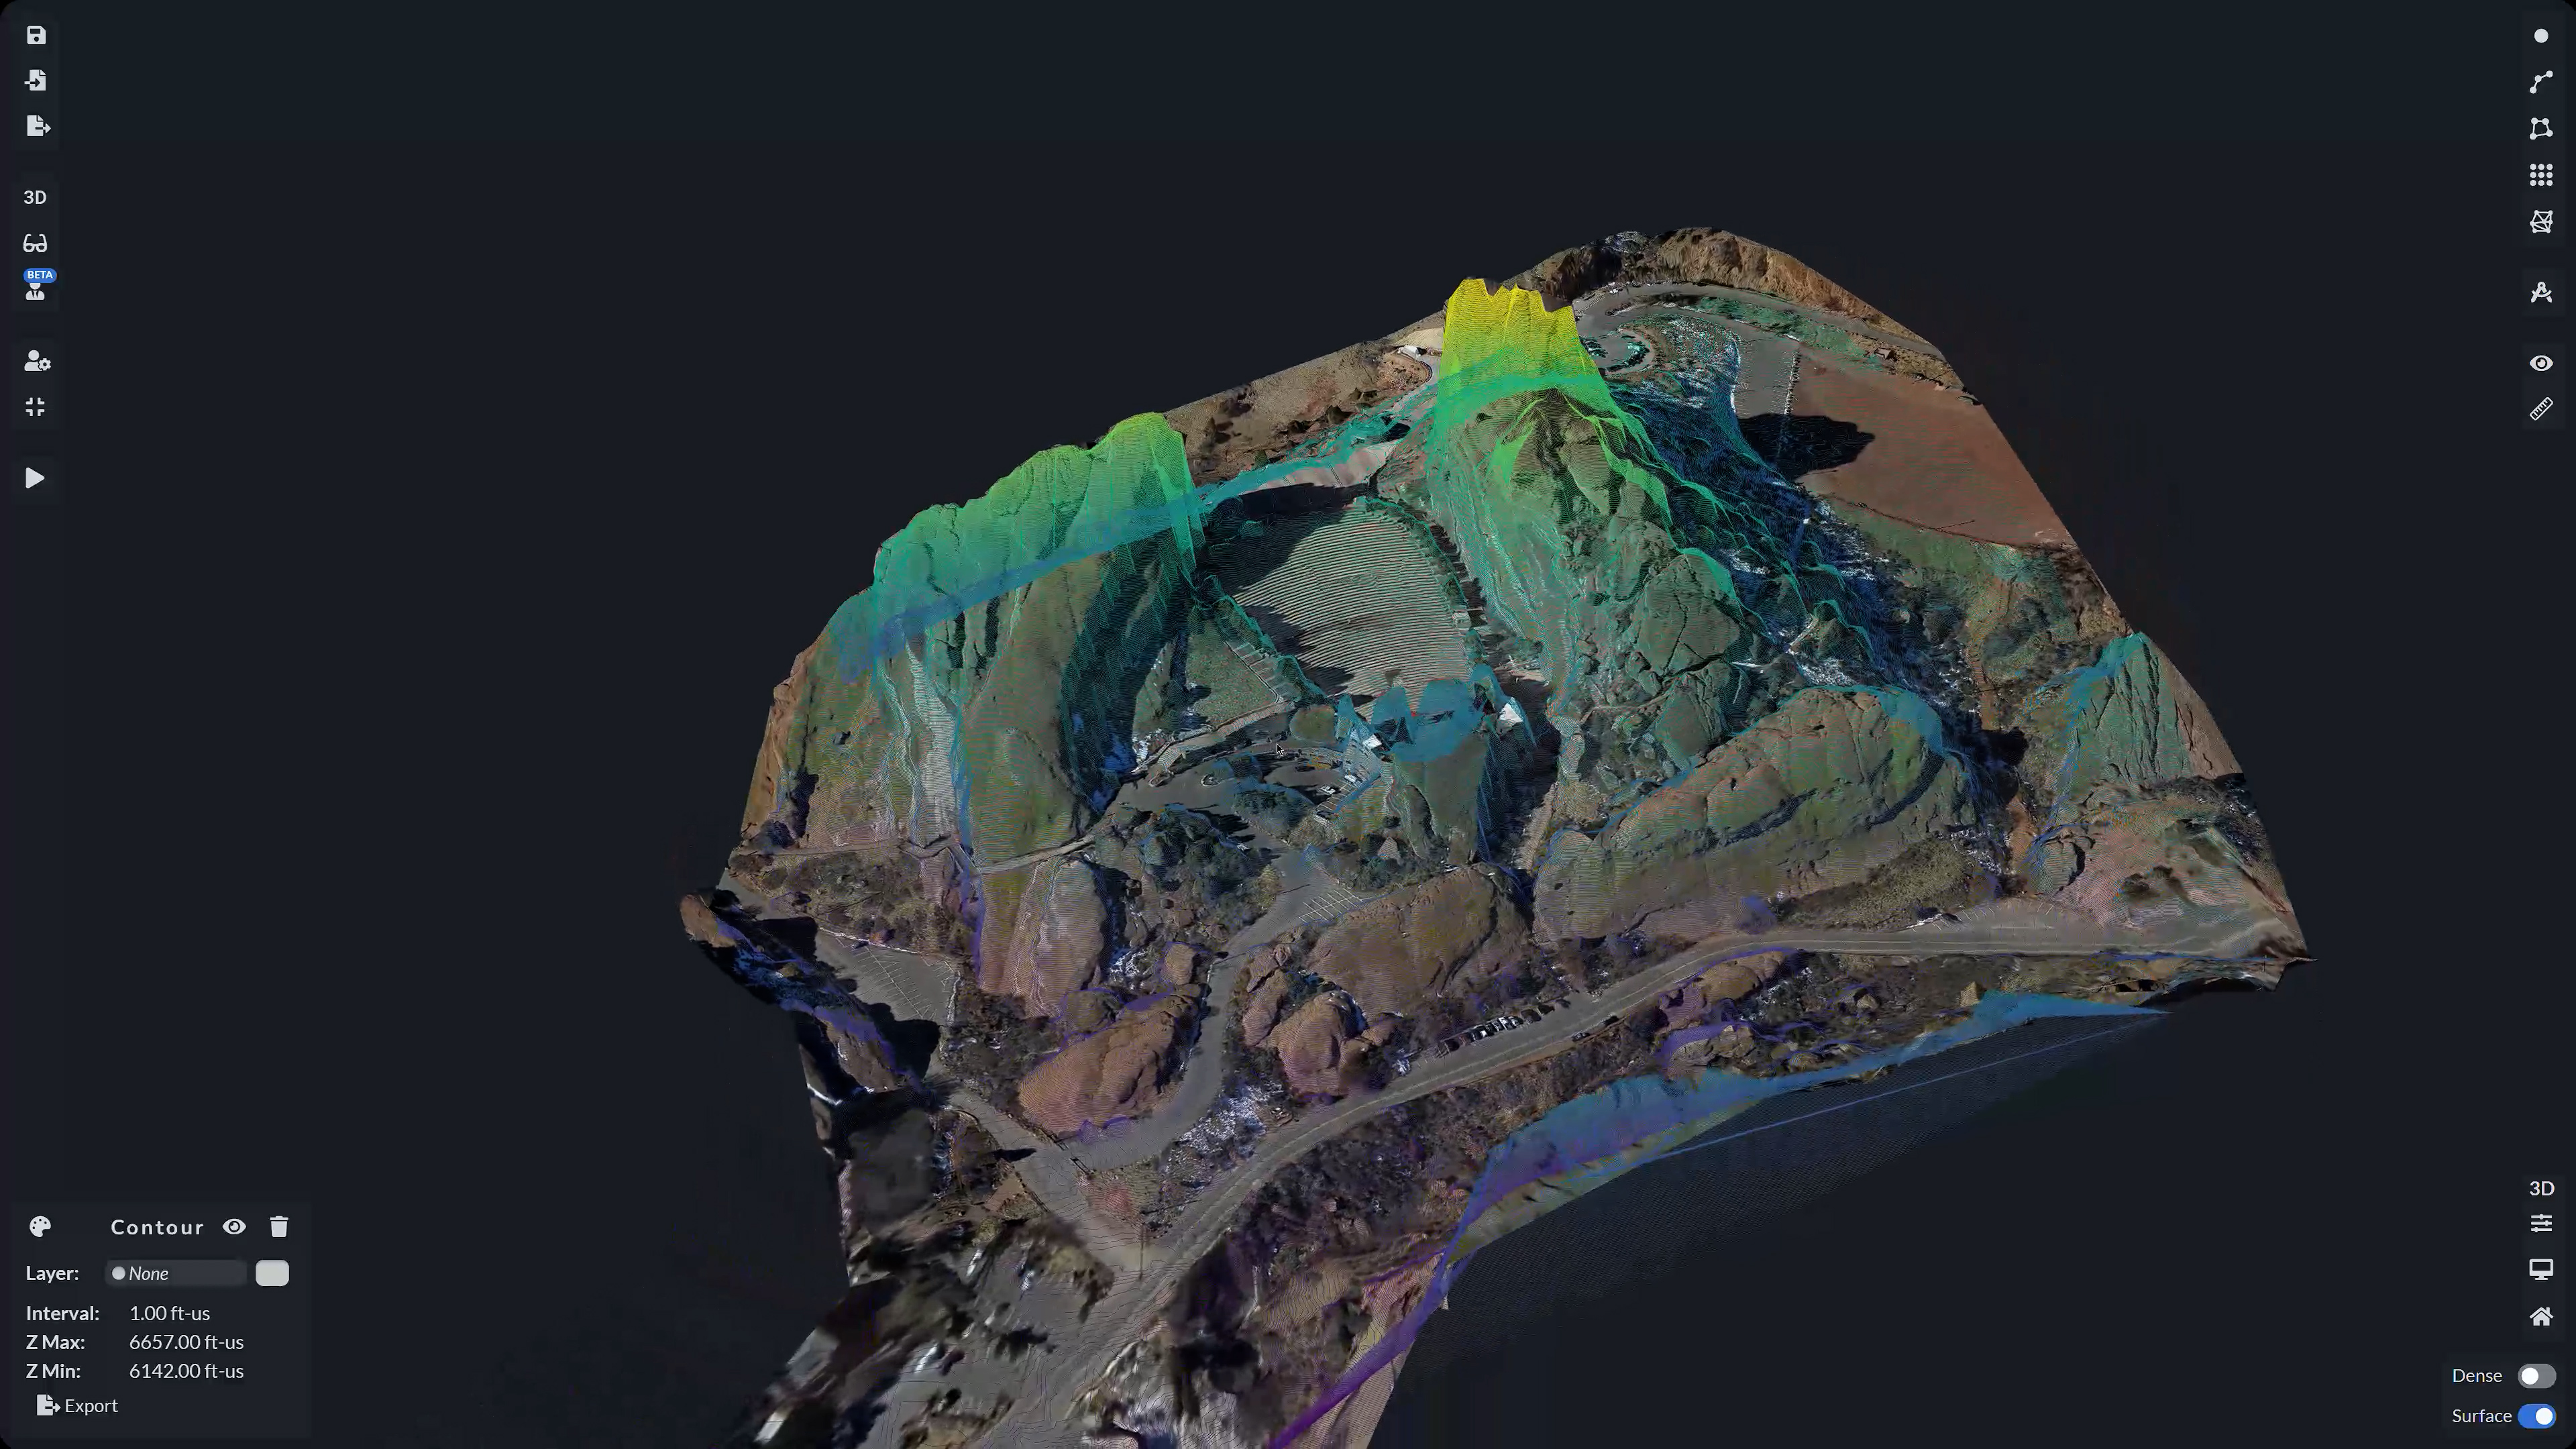
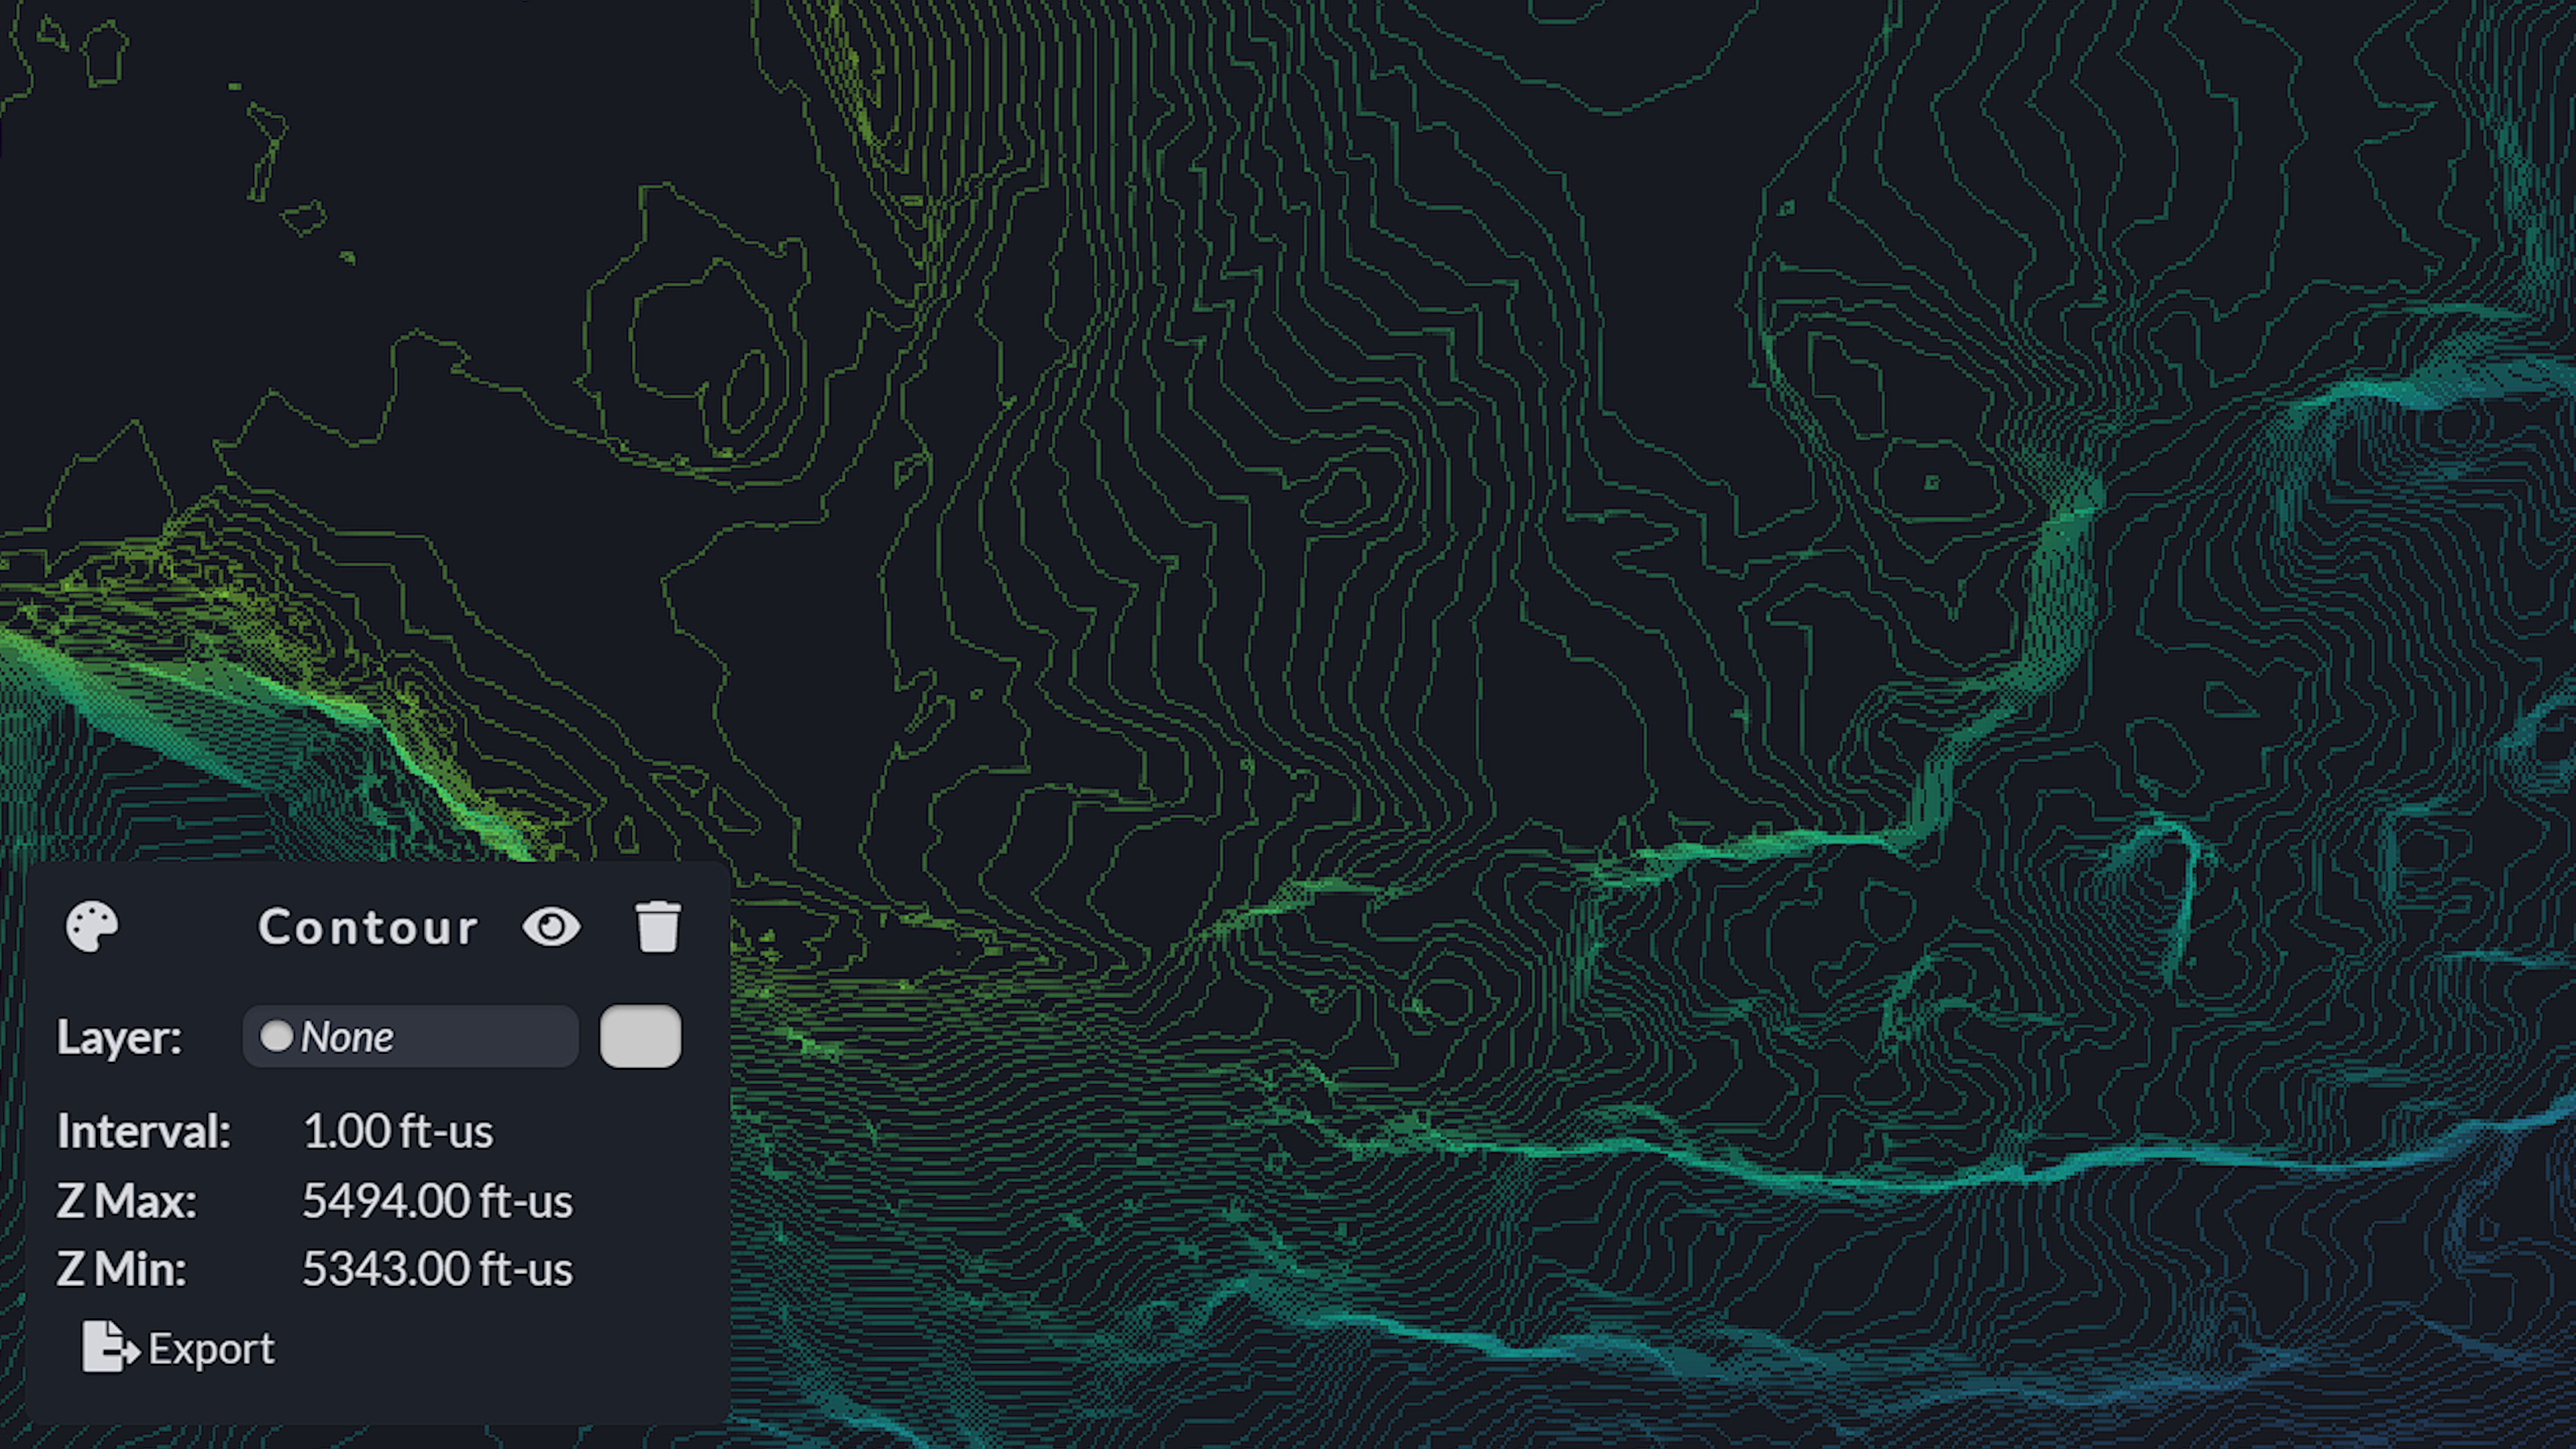
Next you can Generate Contours from the TIN which provides a detailed and visual representation of the topography of the area. This is particularly useful for understanding elevation changes, slope, and terrain features. In the contour submenu, you can customize the interval between contour lines to fit your project’s requirements. You also have access to the maximum and minimum heights recorded during the survey, giving you a clear understanding of your terrain’s extremes.
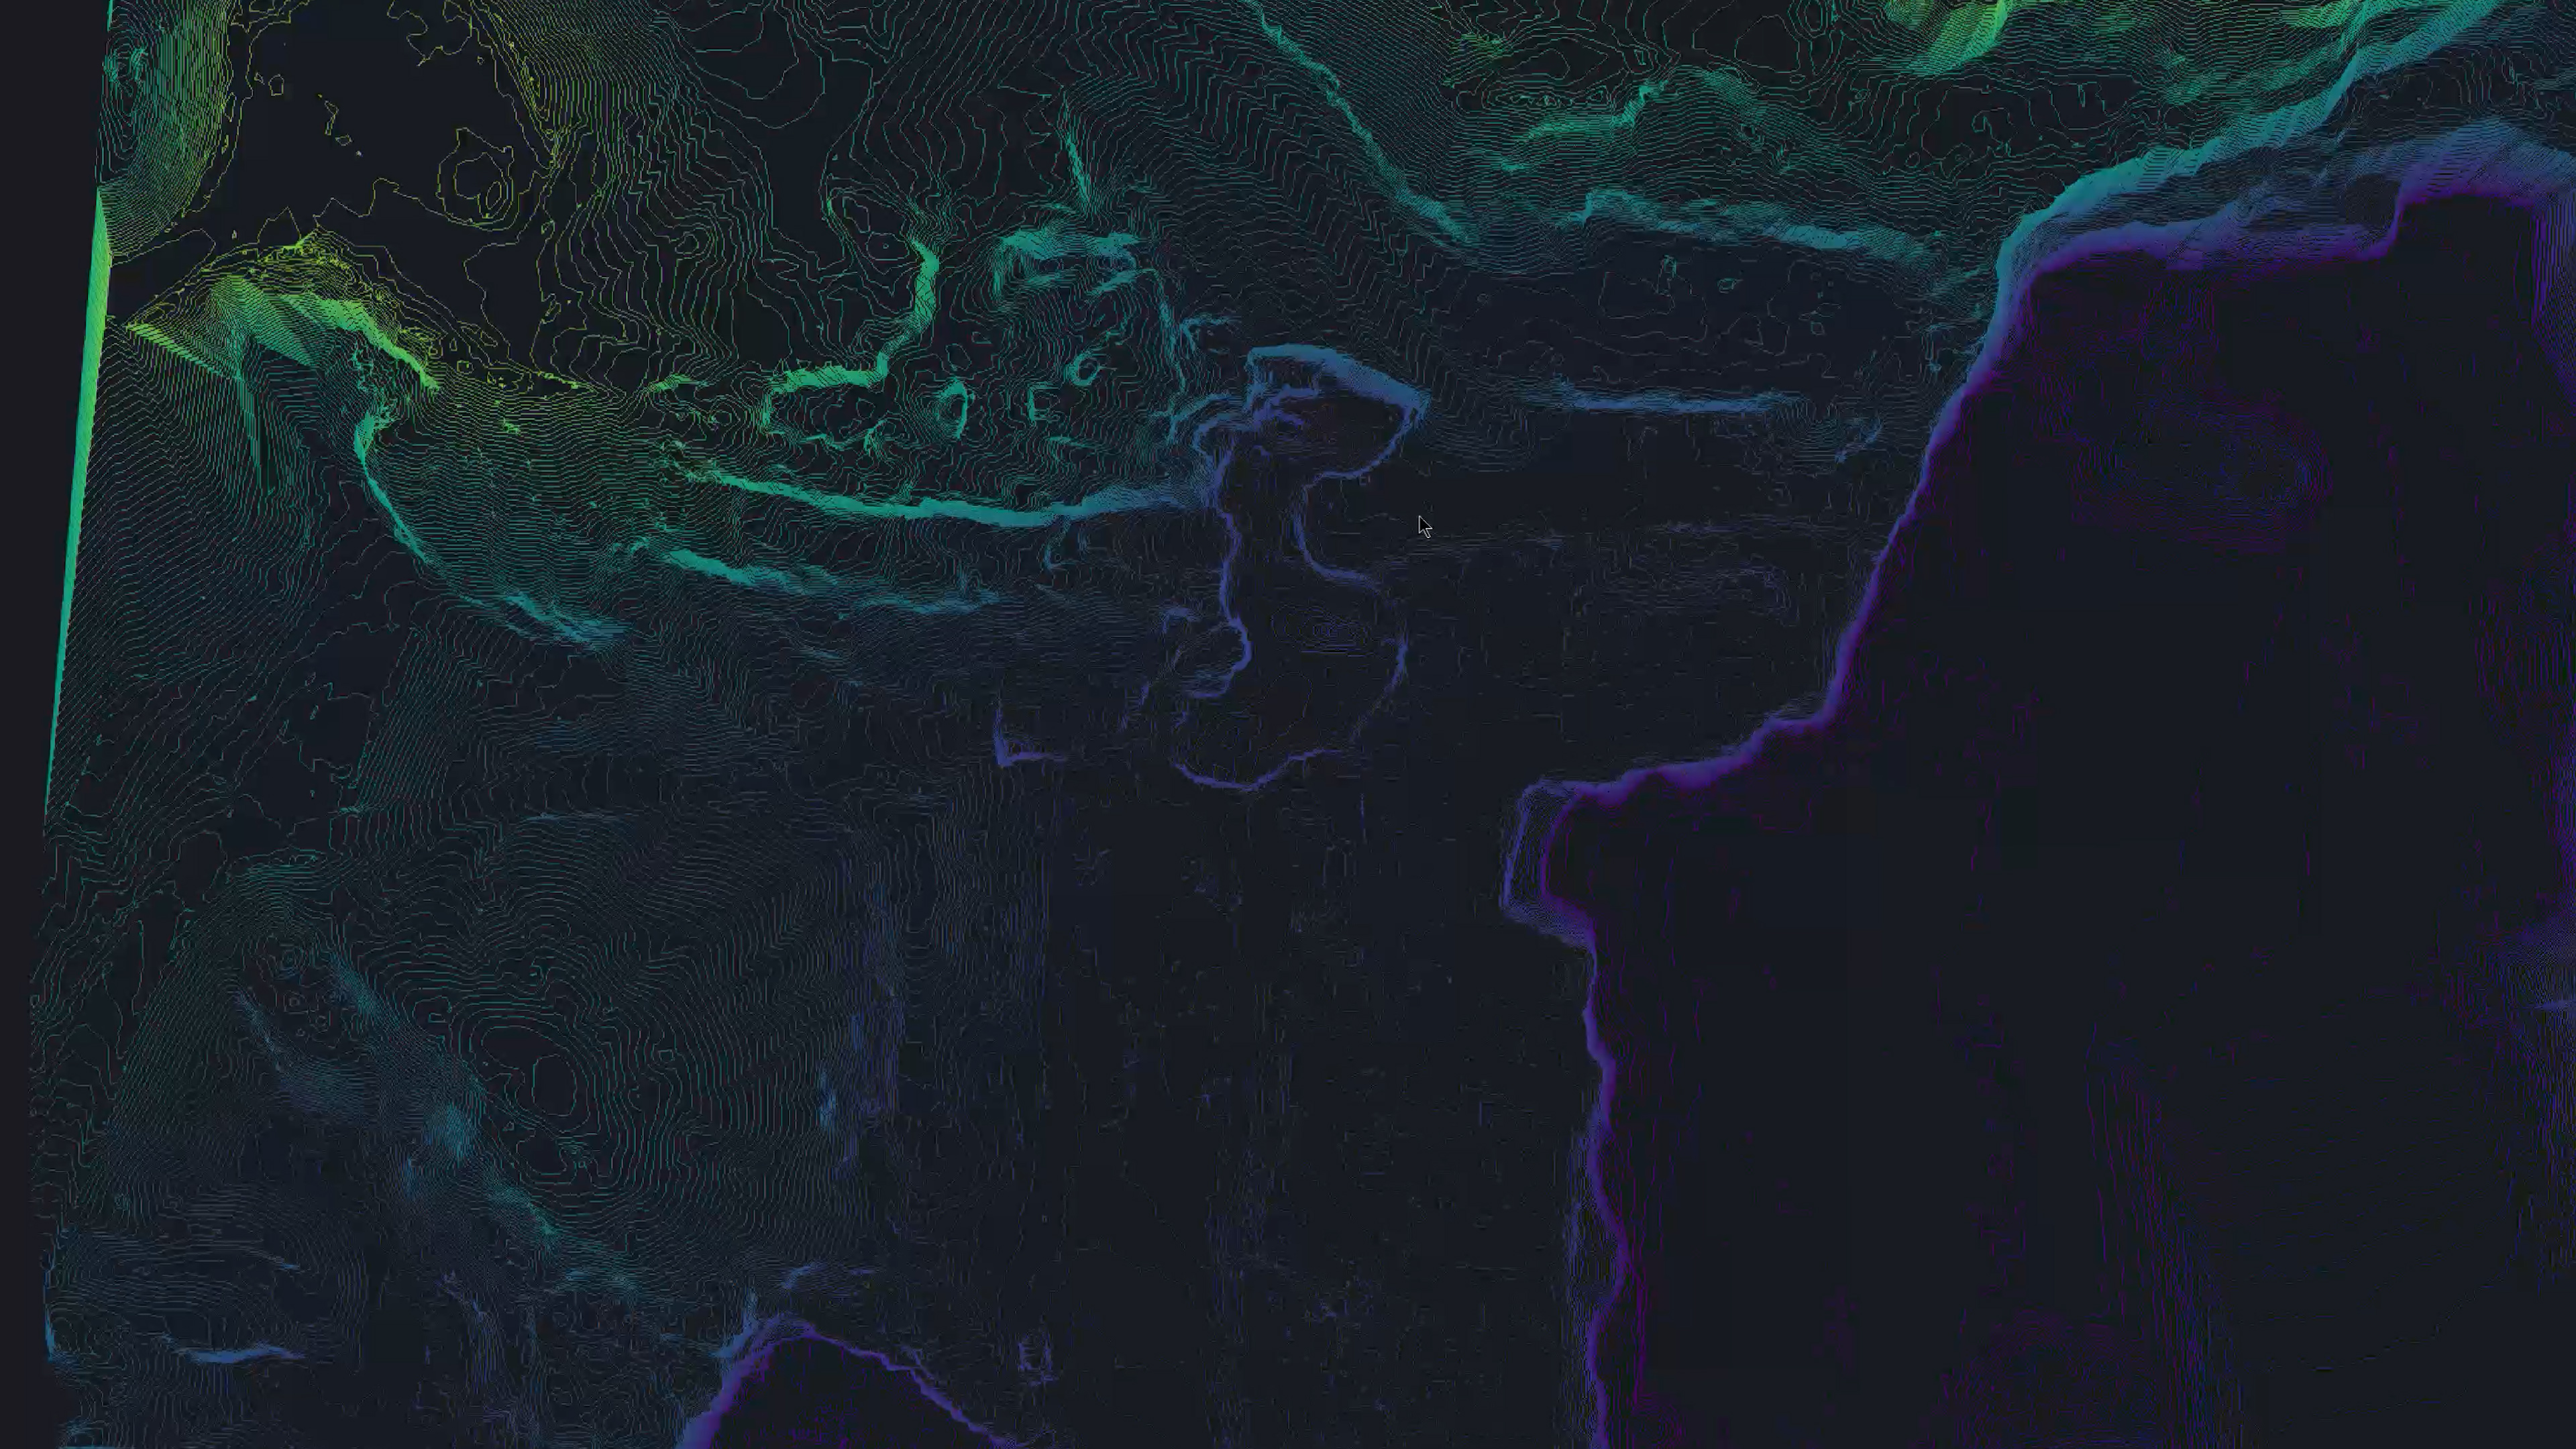
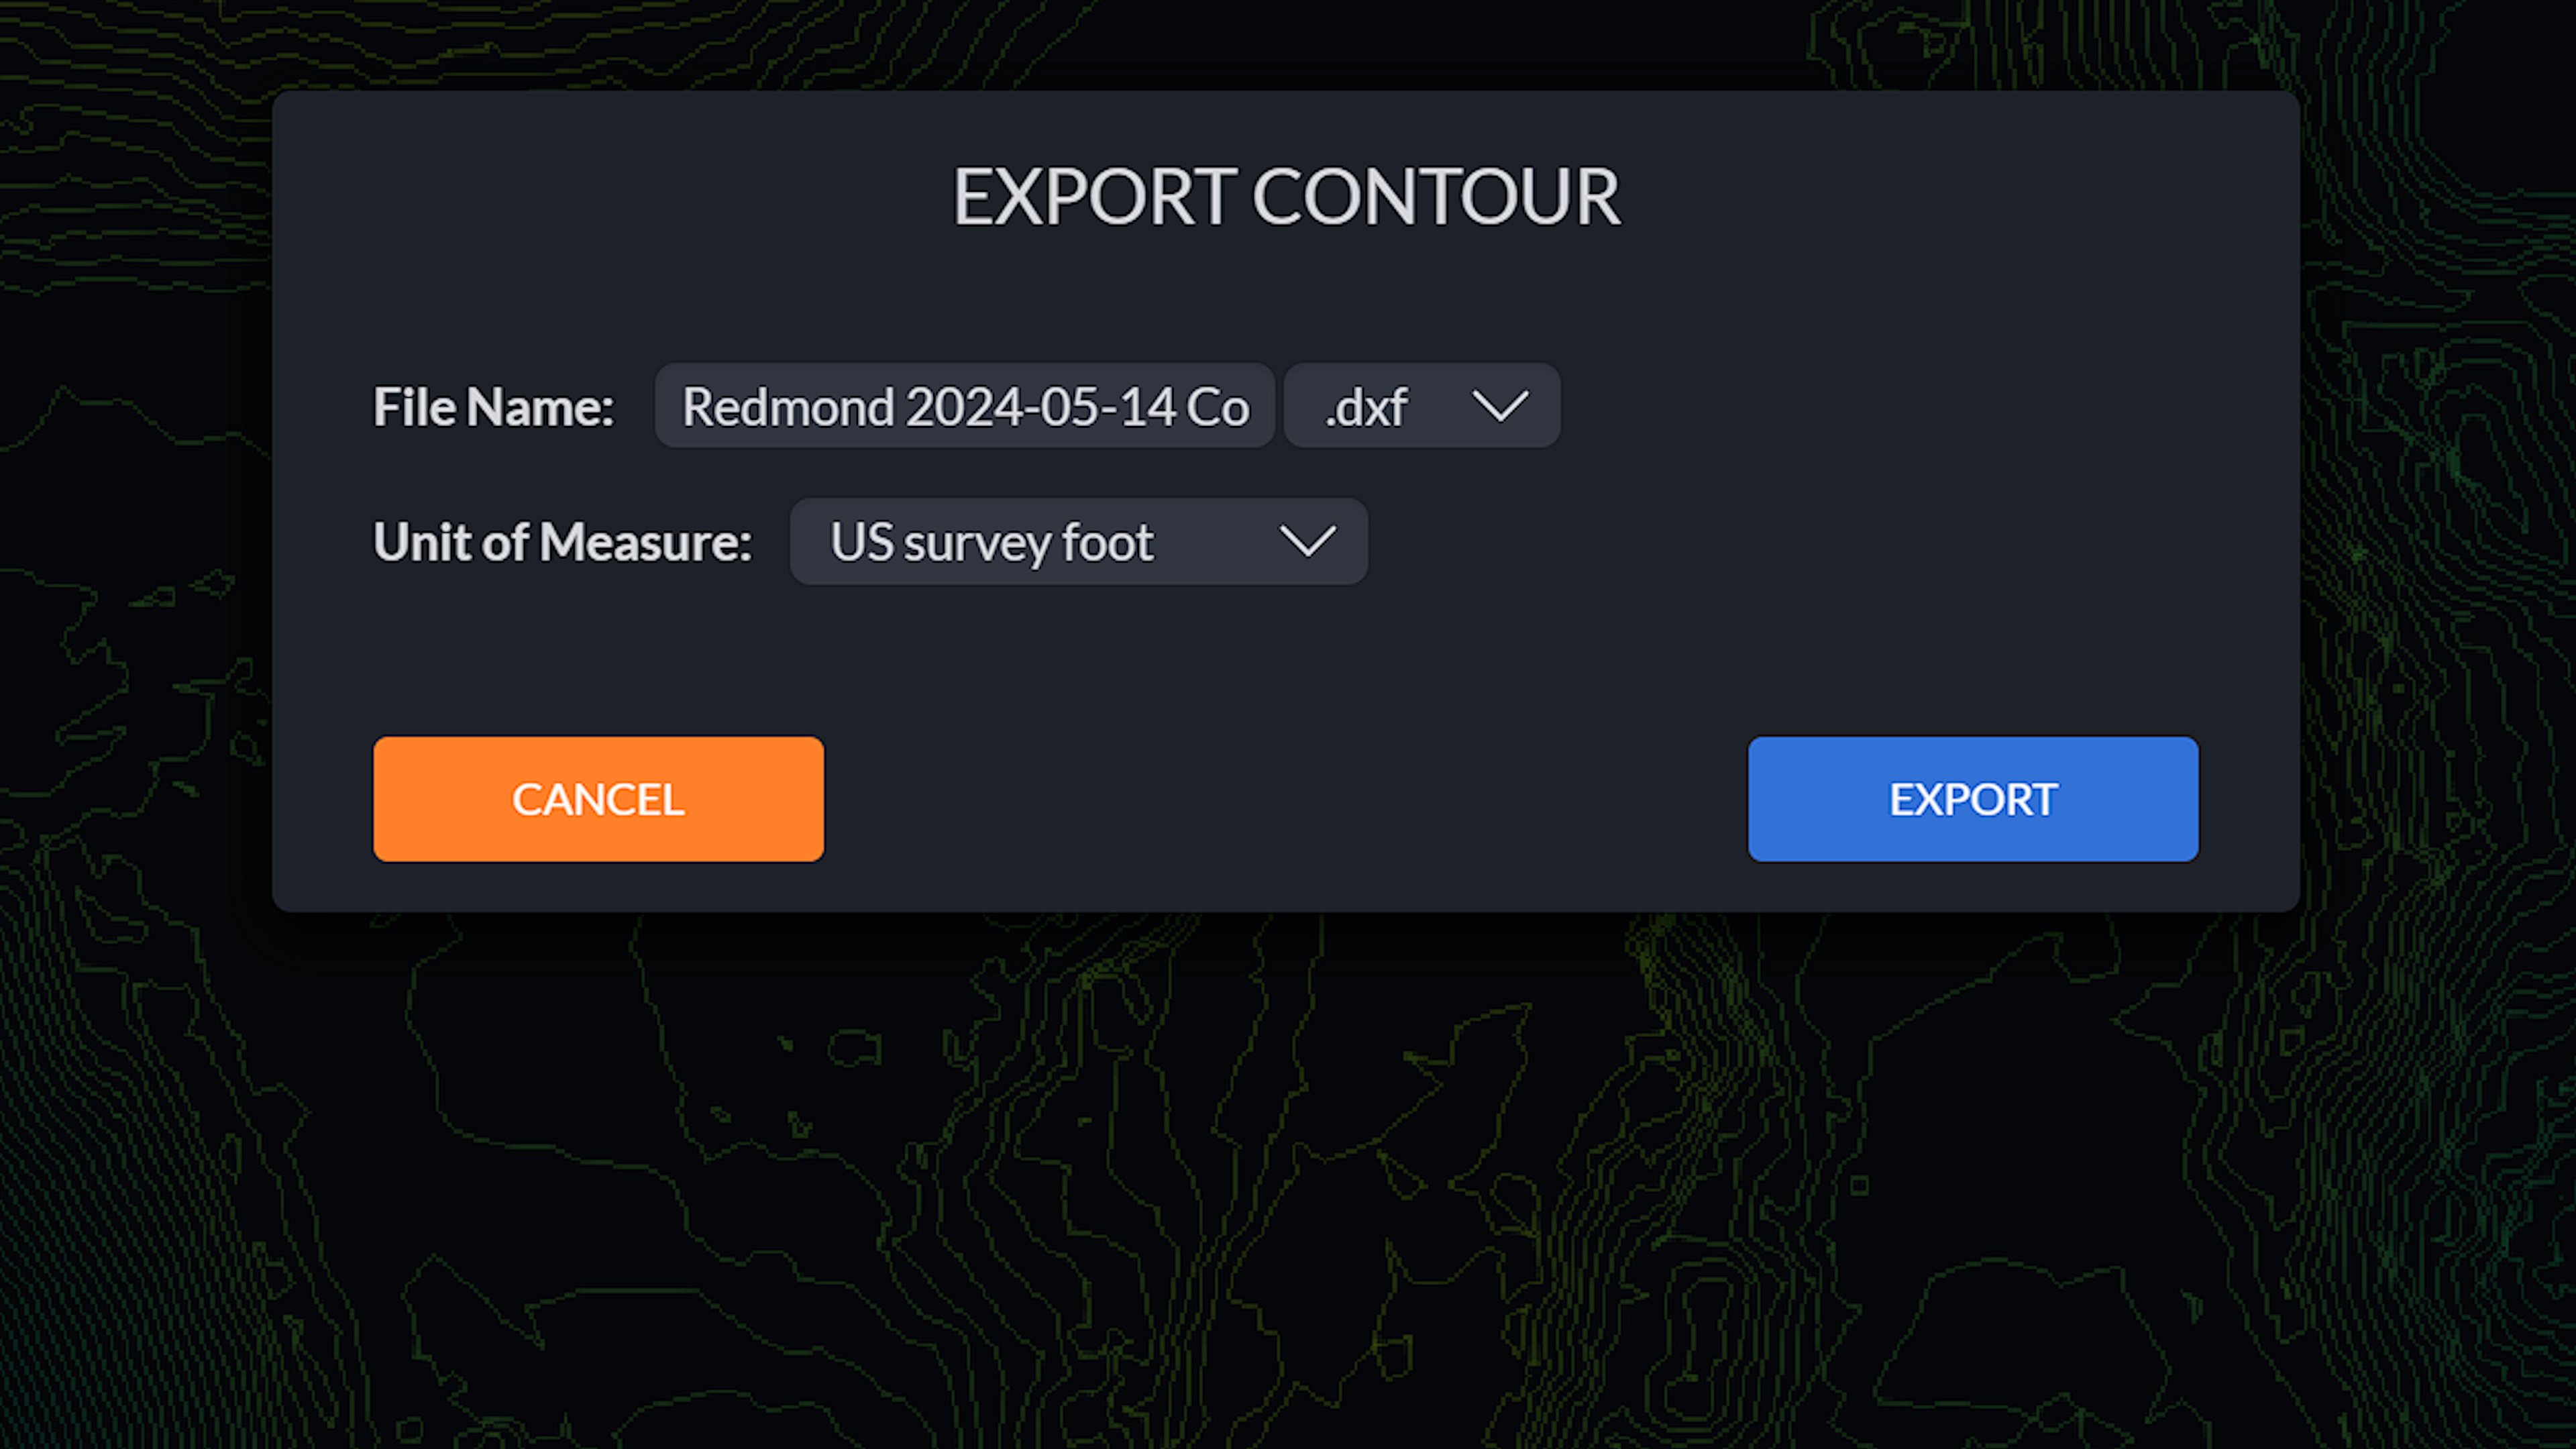
Additionally, the generated contour data can be exported as DXF or SHP files, which are compatible with most CAD and GIS software platforms. This feature streamlines the process of integrating topographical data into your workflows, enabling further analysis, design, or planning.

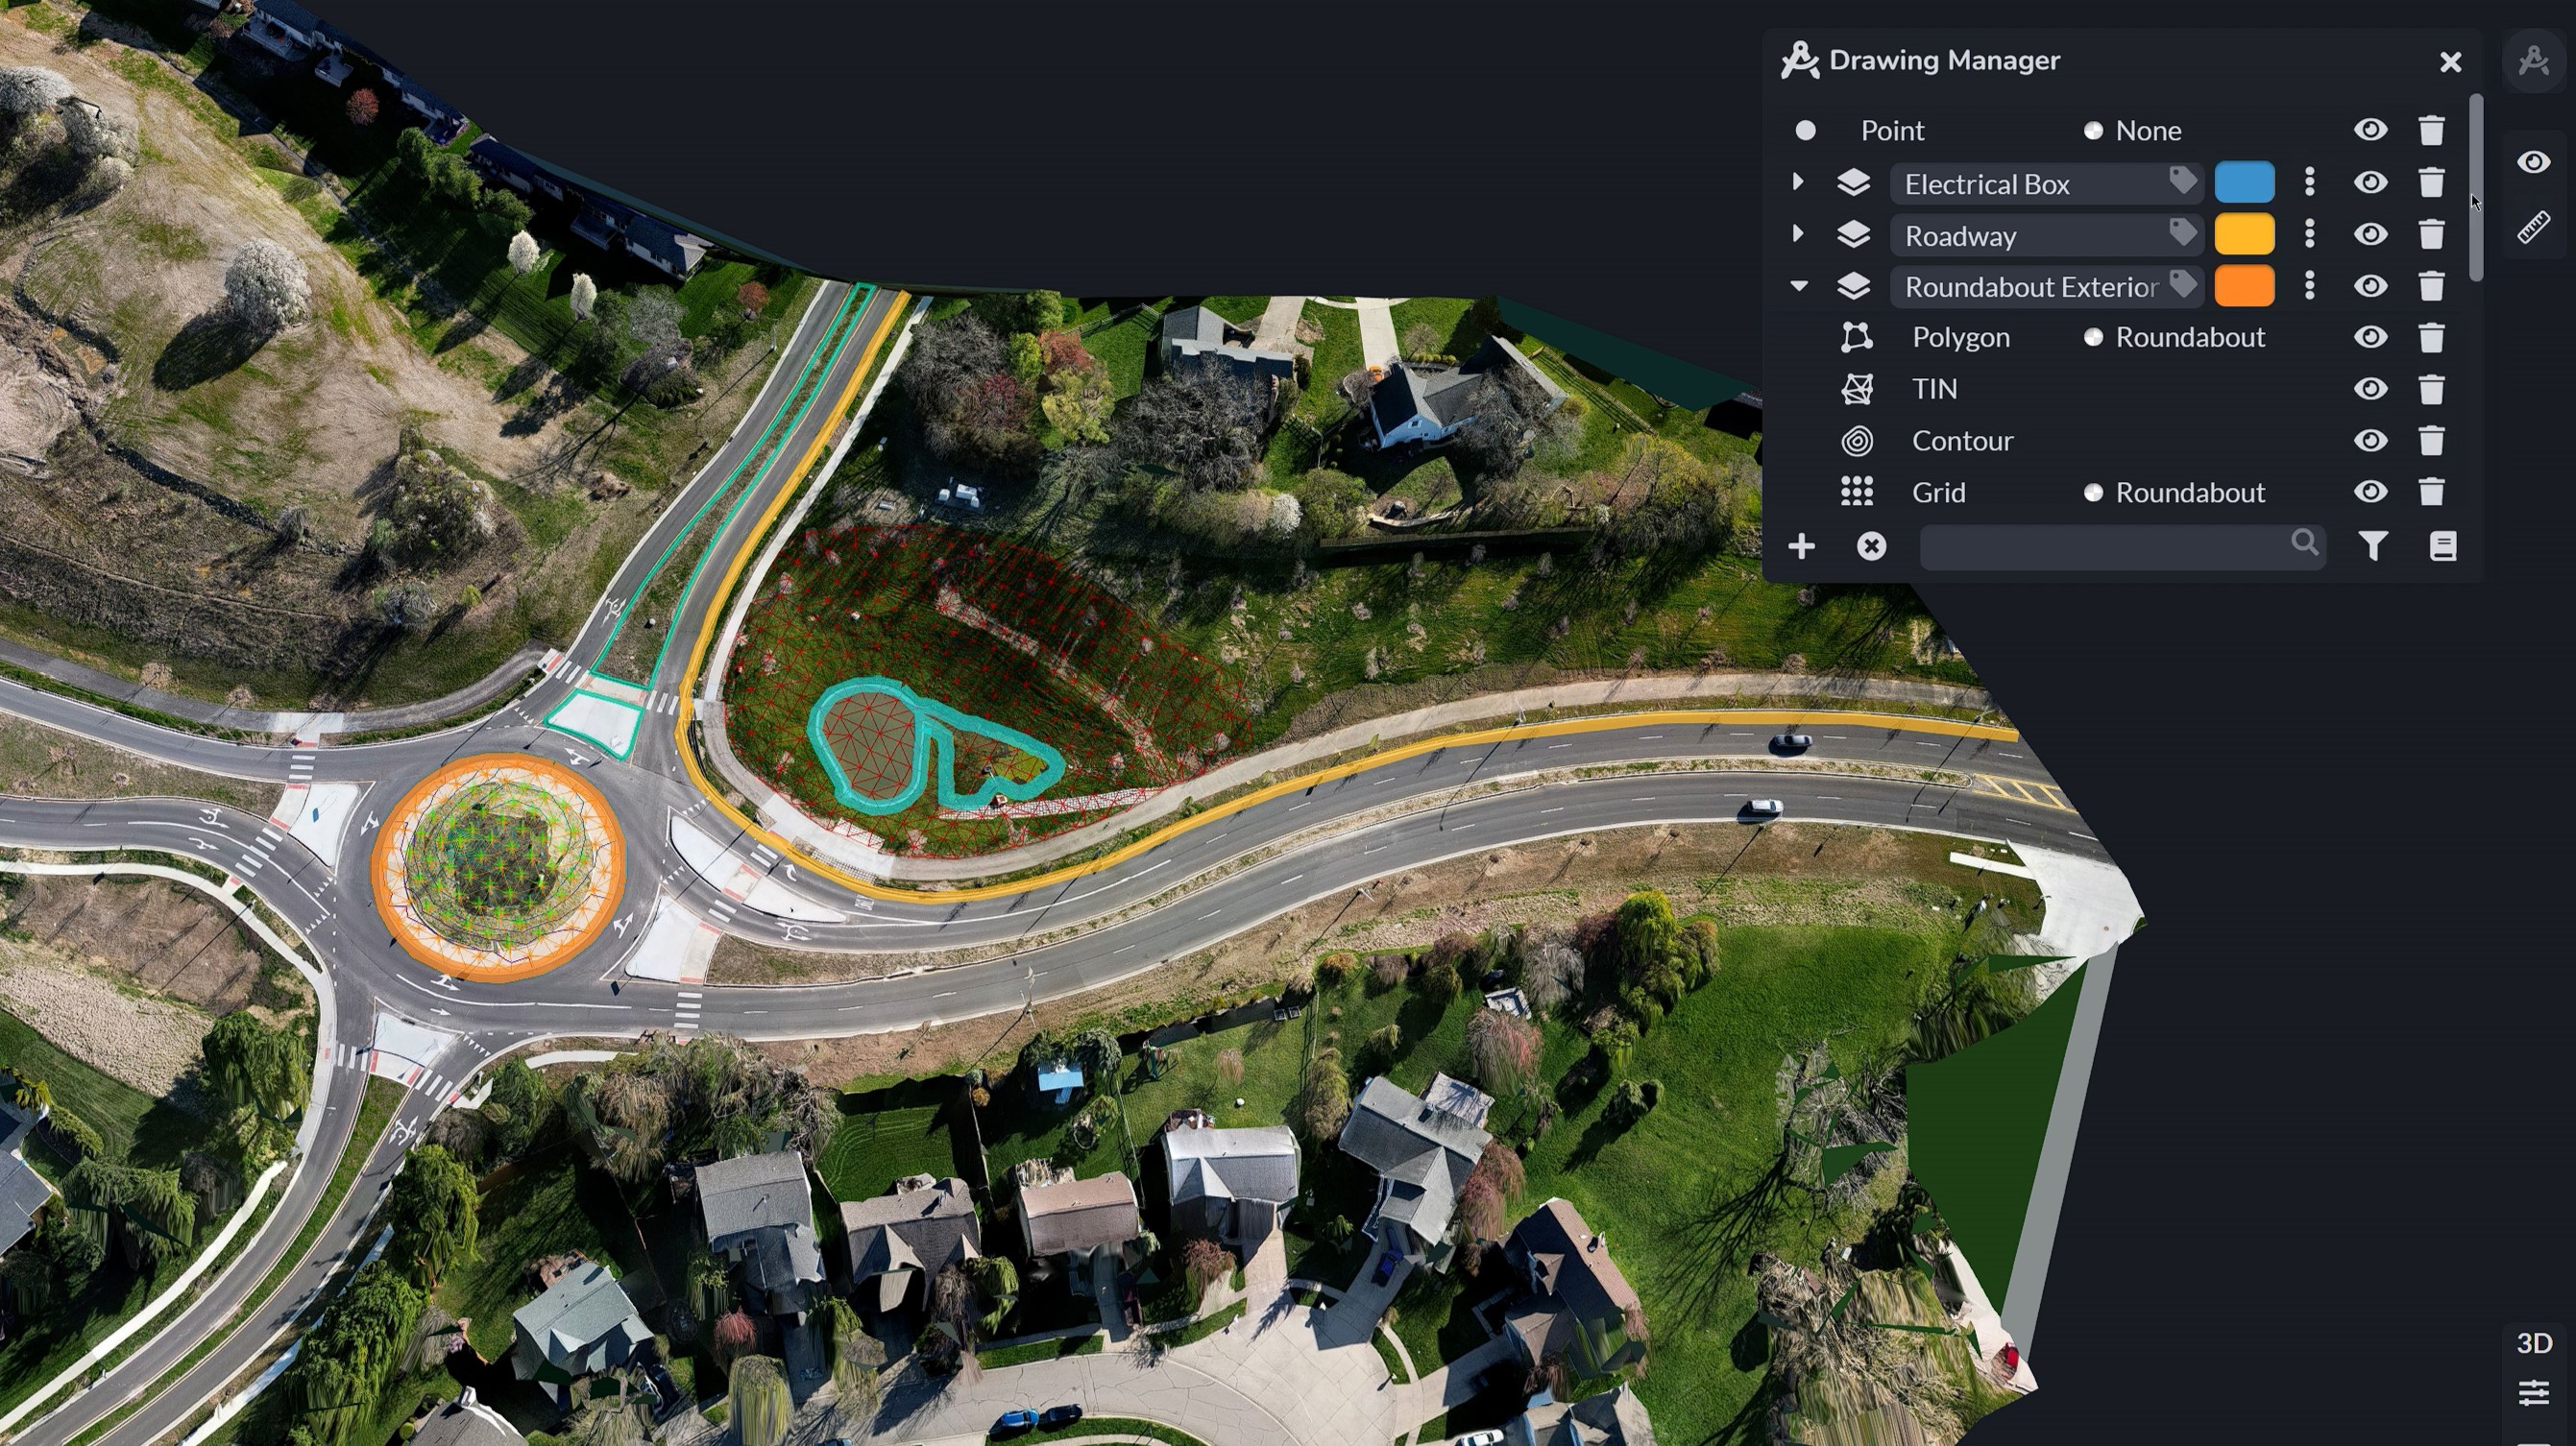
While completing all of your annotations with the tools you are able to view all of your annotations and their respective labels and assigned colors in the Drawing Manager. You are able to toggle whether you are able to see them in the canvas, as well as assign the line width and font sizes of the displayed information. On the bottom menu (from left to right), you are able to add a layer, erase the existing drawing, search as well as filter your layers, and bring up the feature code dictionary for you to reference.

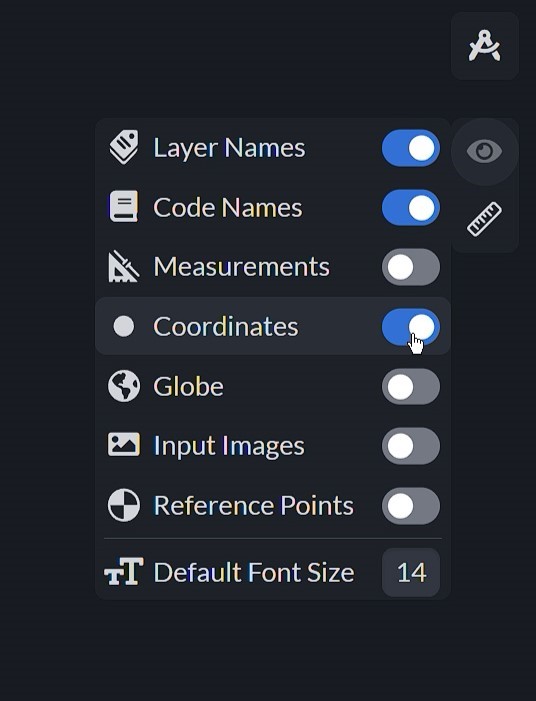
The next tool is the Show/Hide Tool where you can toggle whether you see layer and code names, measurements, coordinates, the base Globe Map, input images, as well as your reference points on the canvas. You are also able to set the default font size for all text.

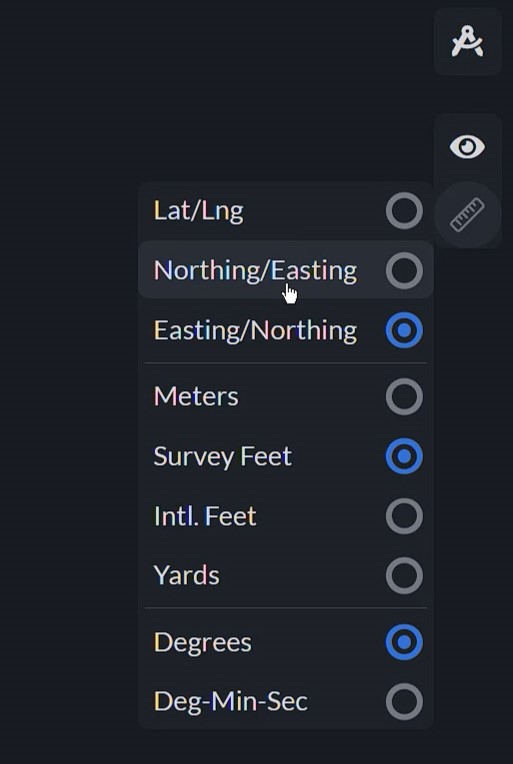
The Units tool allows you to modify the units you wish to display on your annotations.
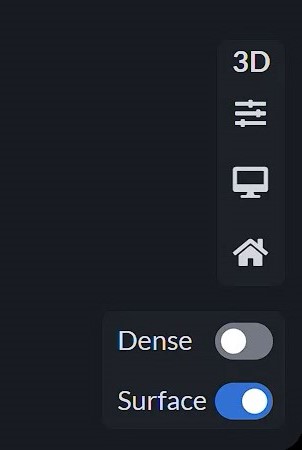
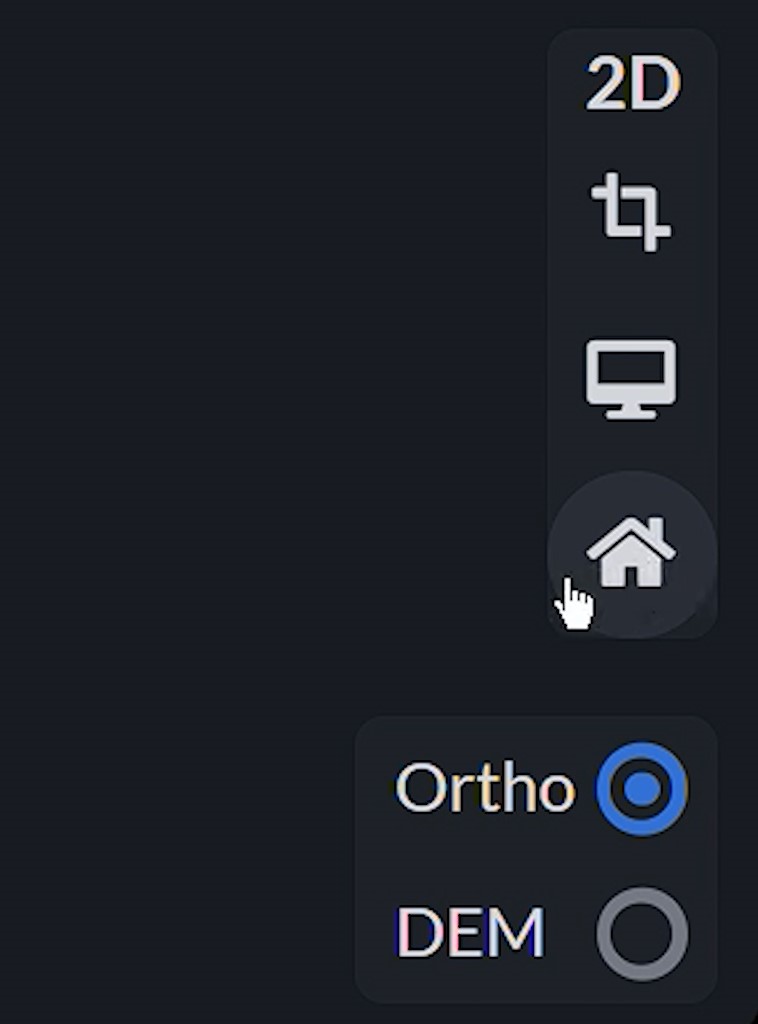
The menu on the bottom right hand side displays the dimension options.
In 2D we are able to crop, capture a screenshot as well as reset the camera. We are also able to toggle whether we want to see the 2D orthomosaic or digital elevation model (DEM).
In 3D view we are able to change our point cloud point size when the colored option is toggled, as well as take a screen capture and reset our camera to the home position.
Conclusion
This wraps up an introduction on how to use the Canvas tab. Please stay tuned for more in-depth tutorials on specific tools and their functionalities within certain map-based scenarios. We’ll delve deeper into each tool’s capabilities, providing practical examples and case studies to help you master their use and unlock the full potential of your mapping projects.