Understanding the Bundle Adjustment Report for your Projects
This tutorial will go through understanding the Bundle Adjustment Report viewable in the overview tab of your project.
If you would like to watch a video version of this tutorial, please view it here:
Understanding the Bundle Adjustment Report
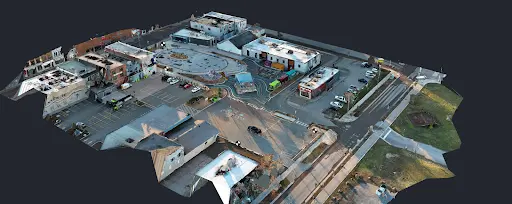
The first thing that is generated, even while your project is still processing, is the bundle adjustment report. This deliverable is a report that gives you all of the information about your flight and how accurately your data was captured.
Project Overview
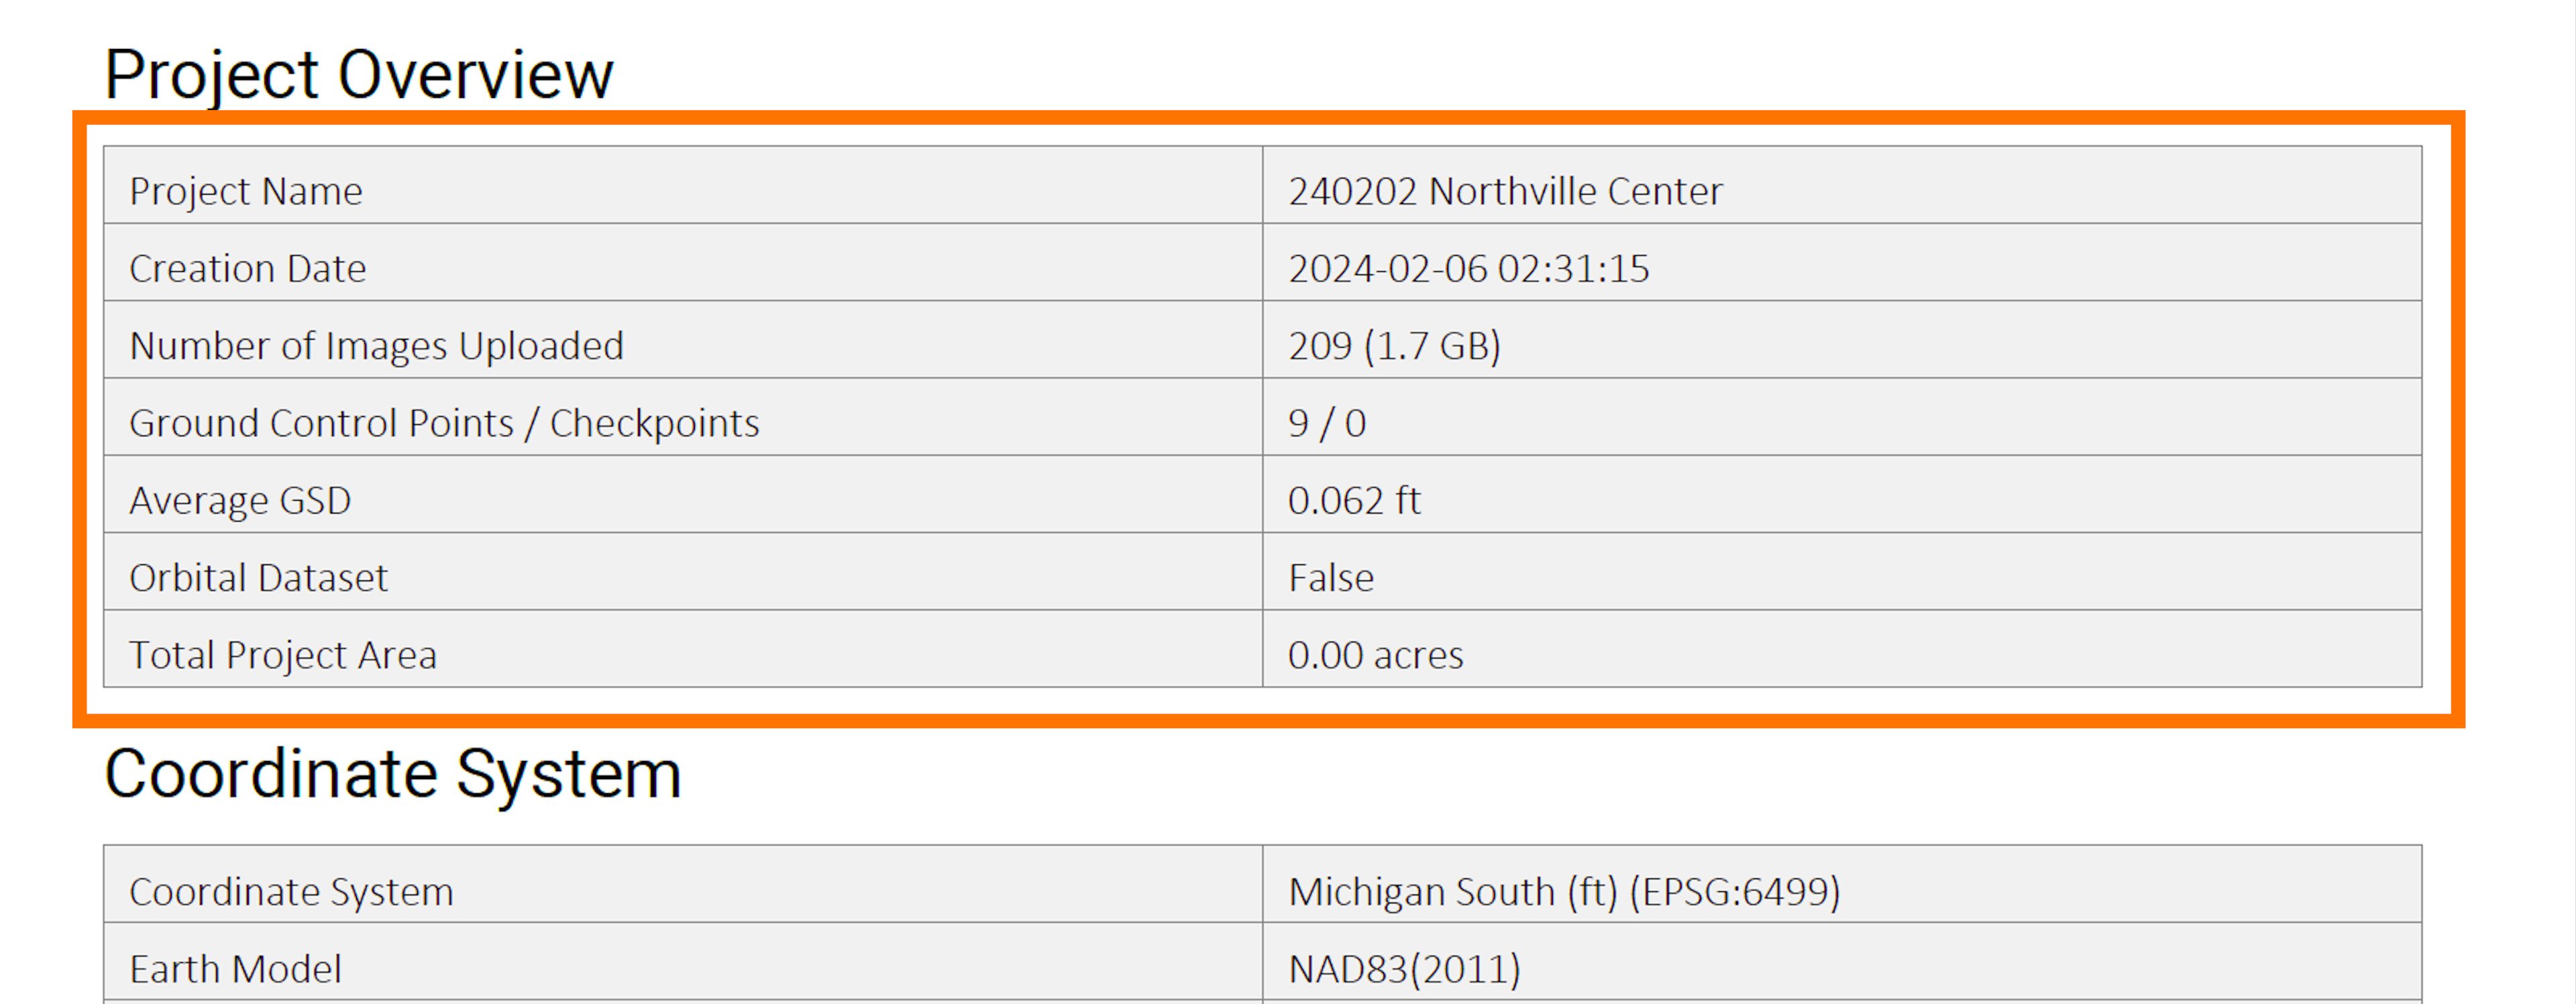
In the Project Overview, you get your project name, creation date, number of images uploaded, how many ground control points or checkpoints you had, the average ground sampling distance, whether your dataset orbited the subject and your total project area.
Coordinate System
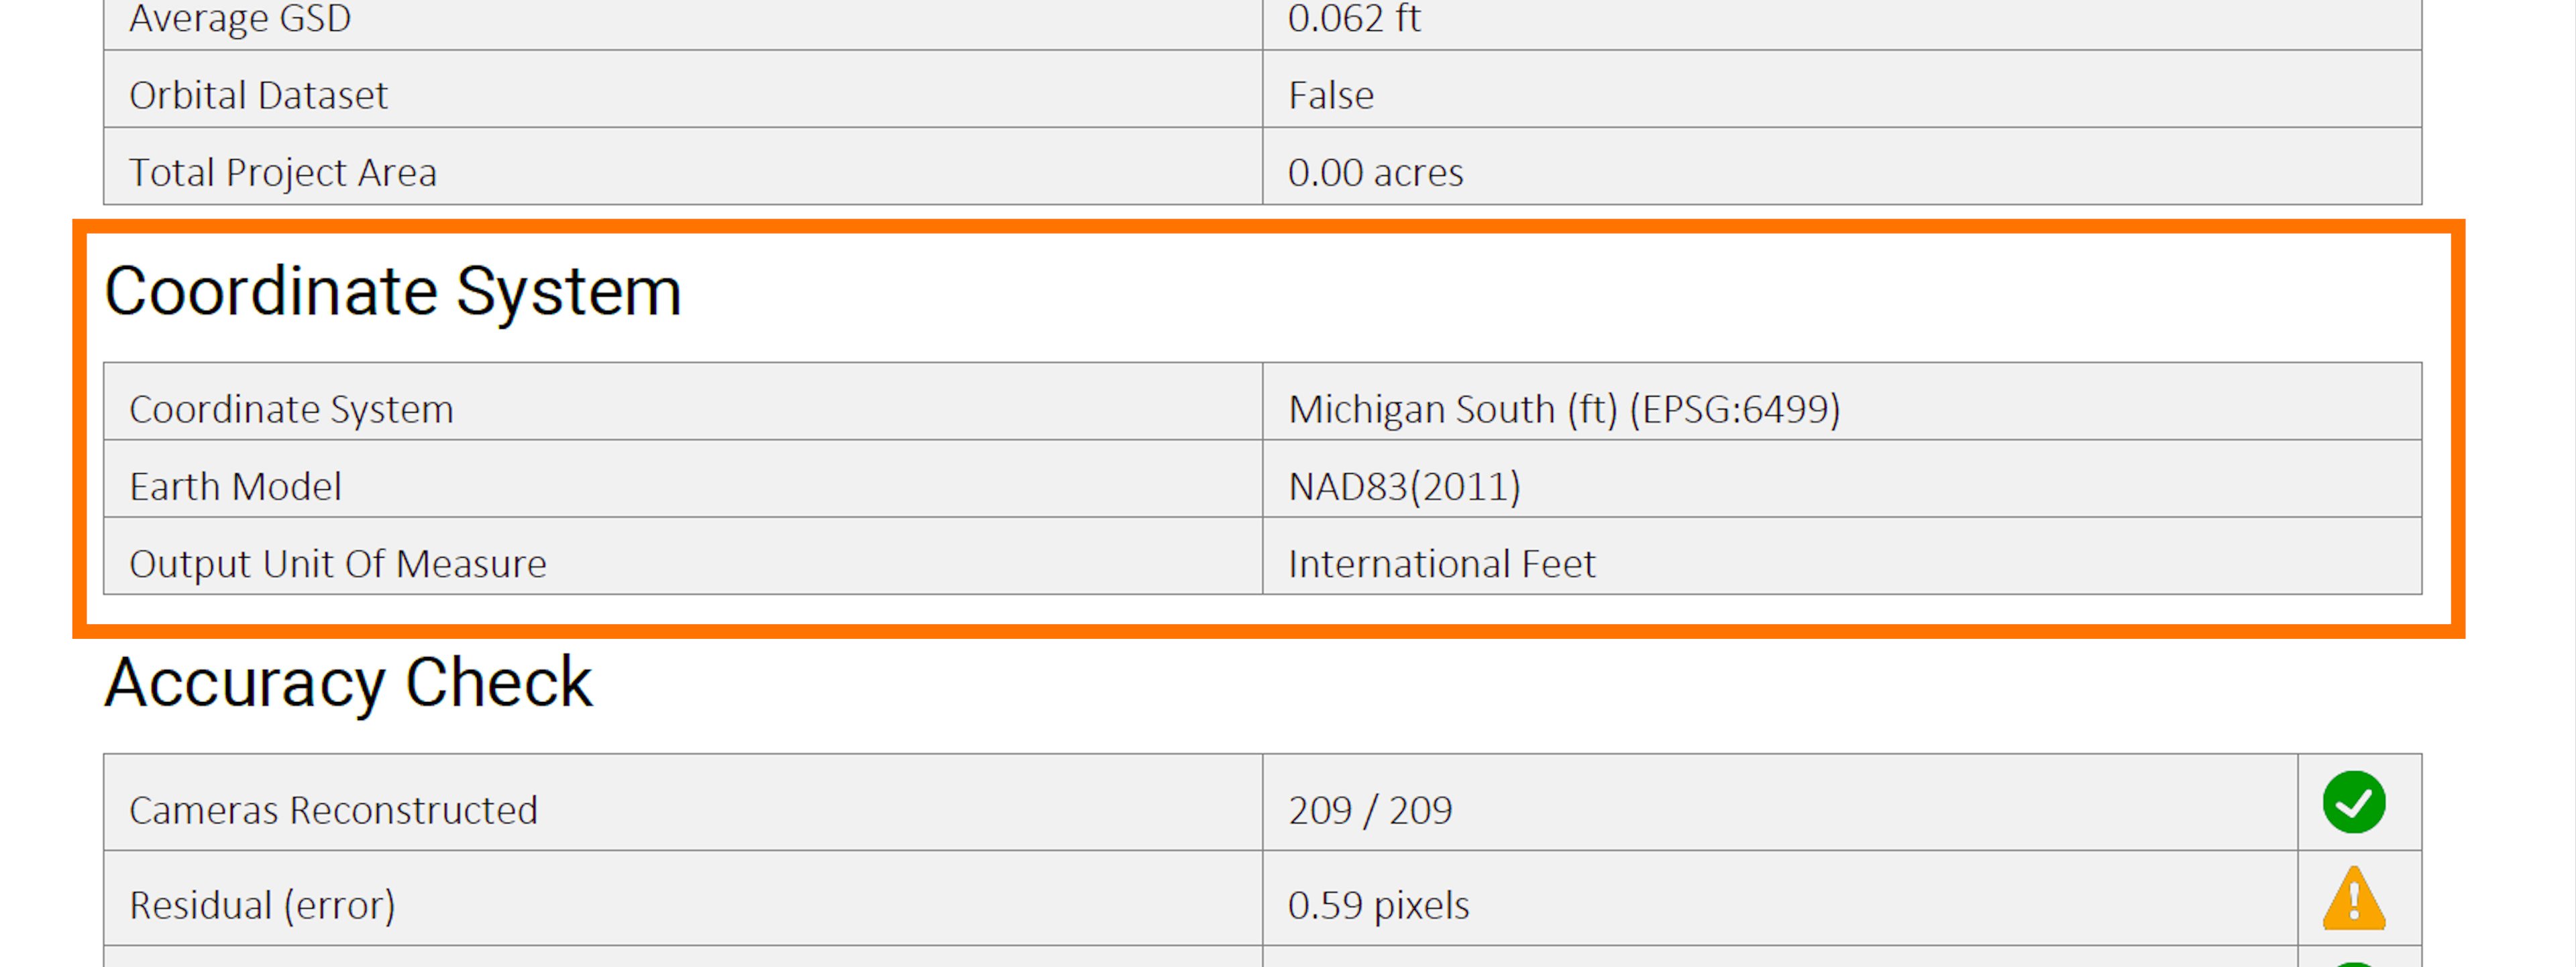
In the Coordinate System overview you are given the coordinate system projection, earth model and output unit used for your deliverables.
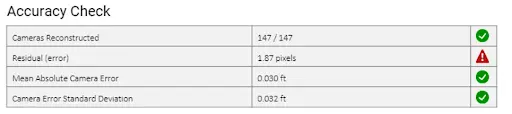
Accuracy Check
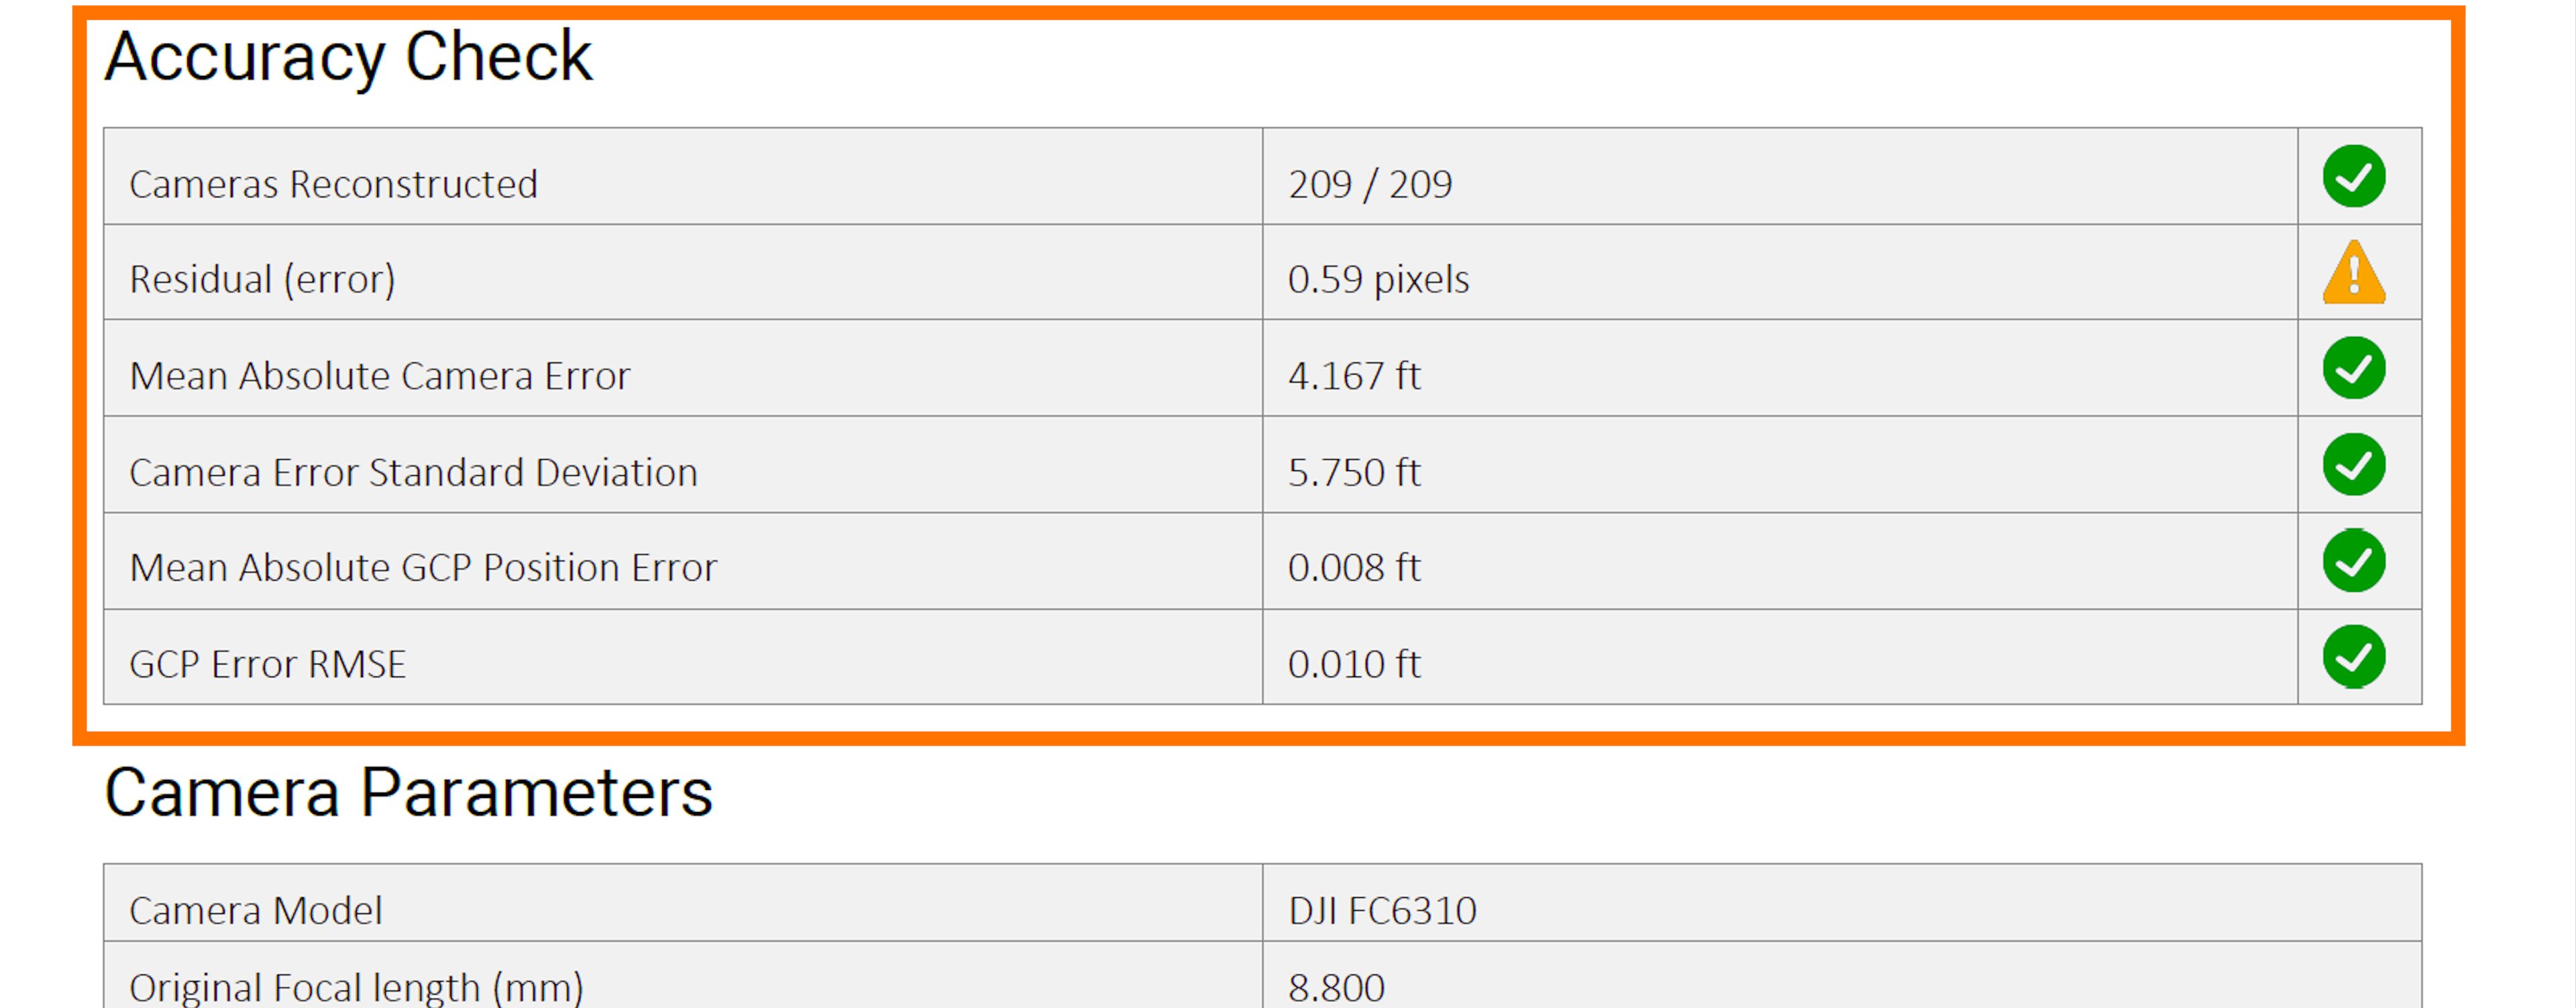
In Accuracy Check, you are given how many photos were used in the project (may be missing some due to takeoff or landing shots, or outlying shots), you also get the residual (error), which refers to the discrepancy between the measured or computed positions of points in the aerial imagery and their true or known positions on the ground. Higher error measurements can arise from various sources including inaccuracies in camera calibration, distortions in the aerial imagery due to atmospheric conditions or lens aberrations, inaccuracies in the positioning and orientation of the aerial platform, and errors in the ground control points used for georeferencing. In the report, the residual error needs to be less than half a pixel to be considered good and get a green circle. The smaller the residual error, the higher accuracy there will be in the photogrammetric reconstruction.
Mean Absolute Camera Error
The mean absolute camera error represents the average magnitude of the difference between the initial camera position, as provided in the image metadata, and the estimated camera position, which is computed by PixElement as part of the bundle adjustment process.
If you have an RTK or PPK drone, you should see much smaller camera position errors as compared to a non-RTK/PPK drone (example from RTK project vs non-RTK project). This is because the camera positional accuracy provided in the image metadata is centimeter level for RTK and PPK capable drones, as compared to their non RTK/PPK counterparts.
Camera Error Standard Deviation
Next you get the camera error standard deviation, which measures the spread or dispersion of the camera parameter errors around their mean value. It provides insight into the consistency and precision of the estimated camera positions. A lower standard deviation indicates less variability in the errors, suggesting more consistent and precise estimation of camera positions.
We are then given the GCP Error RMSE, or Root Mean Square Error which measures the difference between the predicted or estimated positions of ground control points (GCPs) and their actual positions on the Earth’s surface. A lower RMSE value indicates better accuracy. This section of the report is a good way to check to make sure that your dataset is in good shape. On the far right is a status of each parameter (Green, Yellow or Red).
Camera Parameters
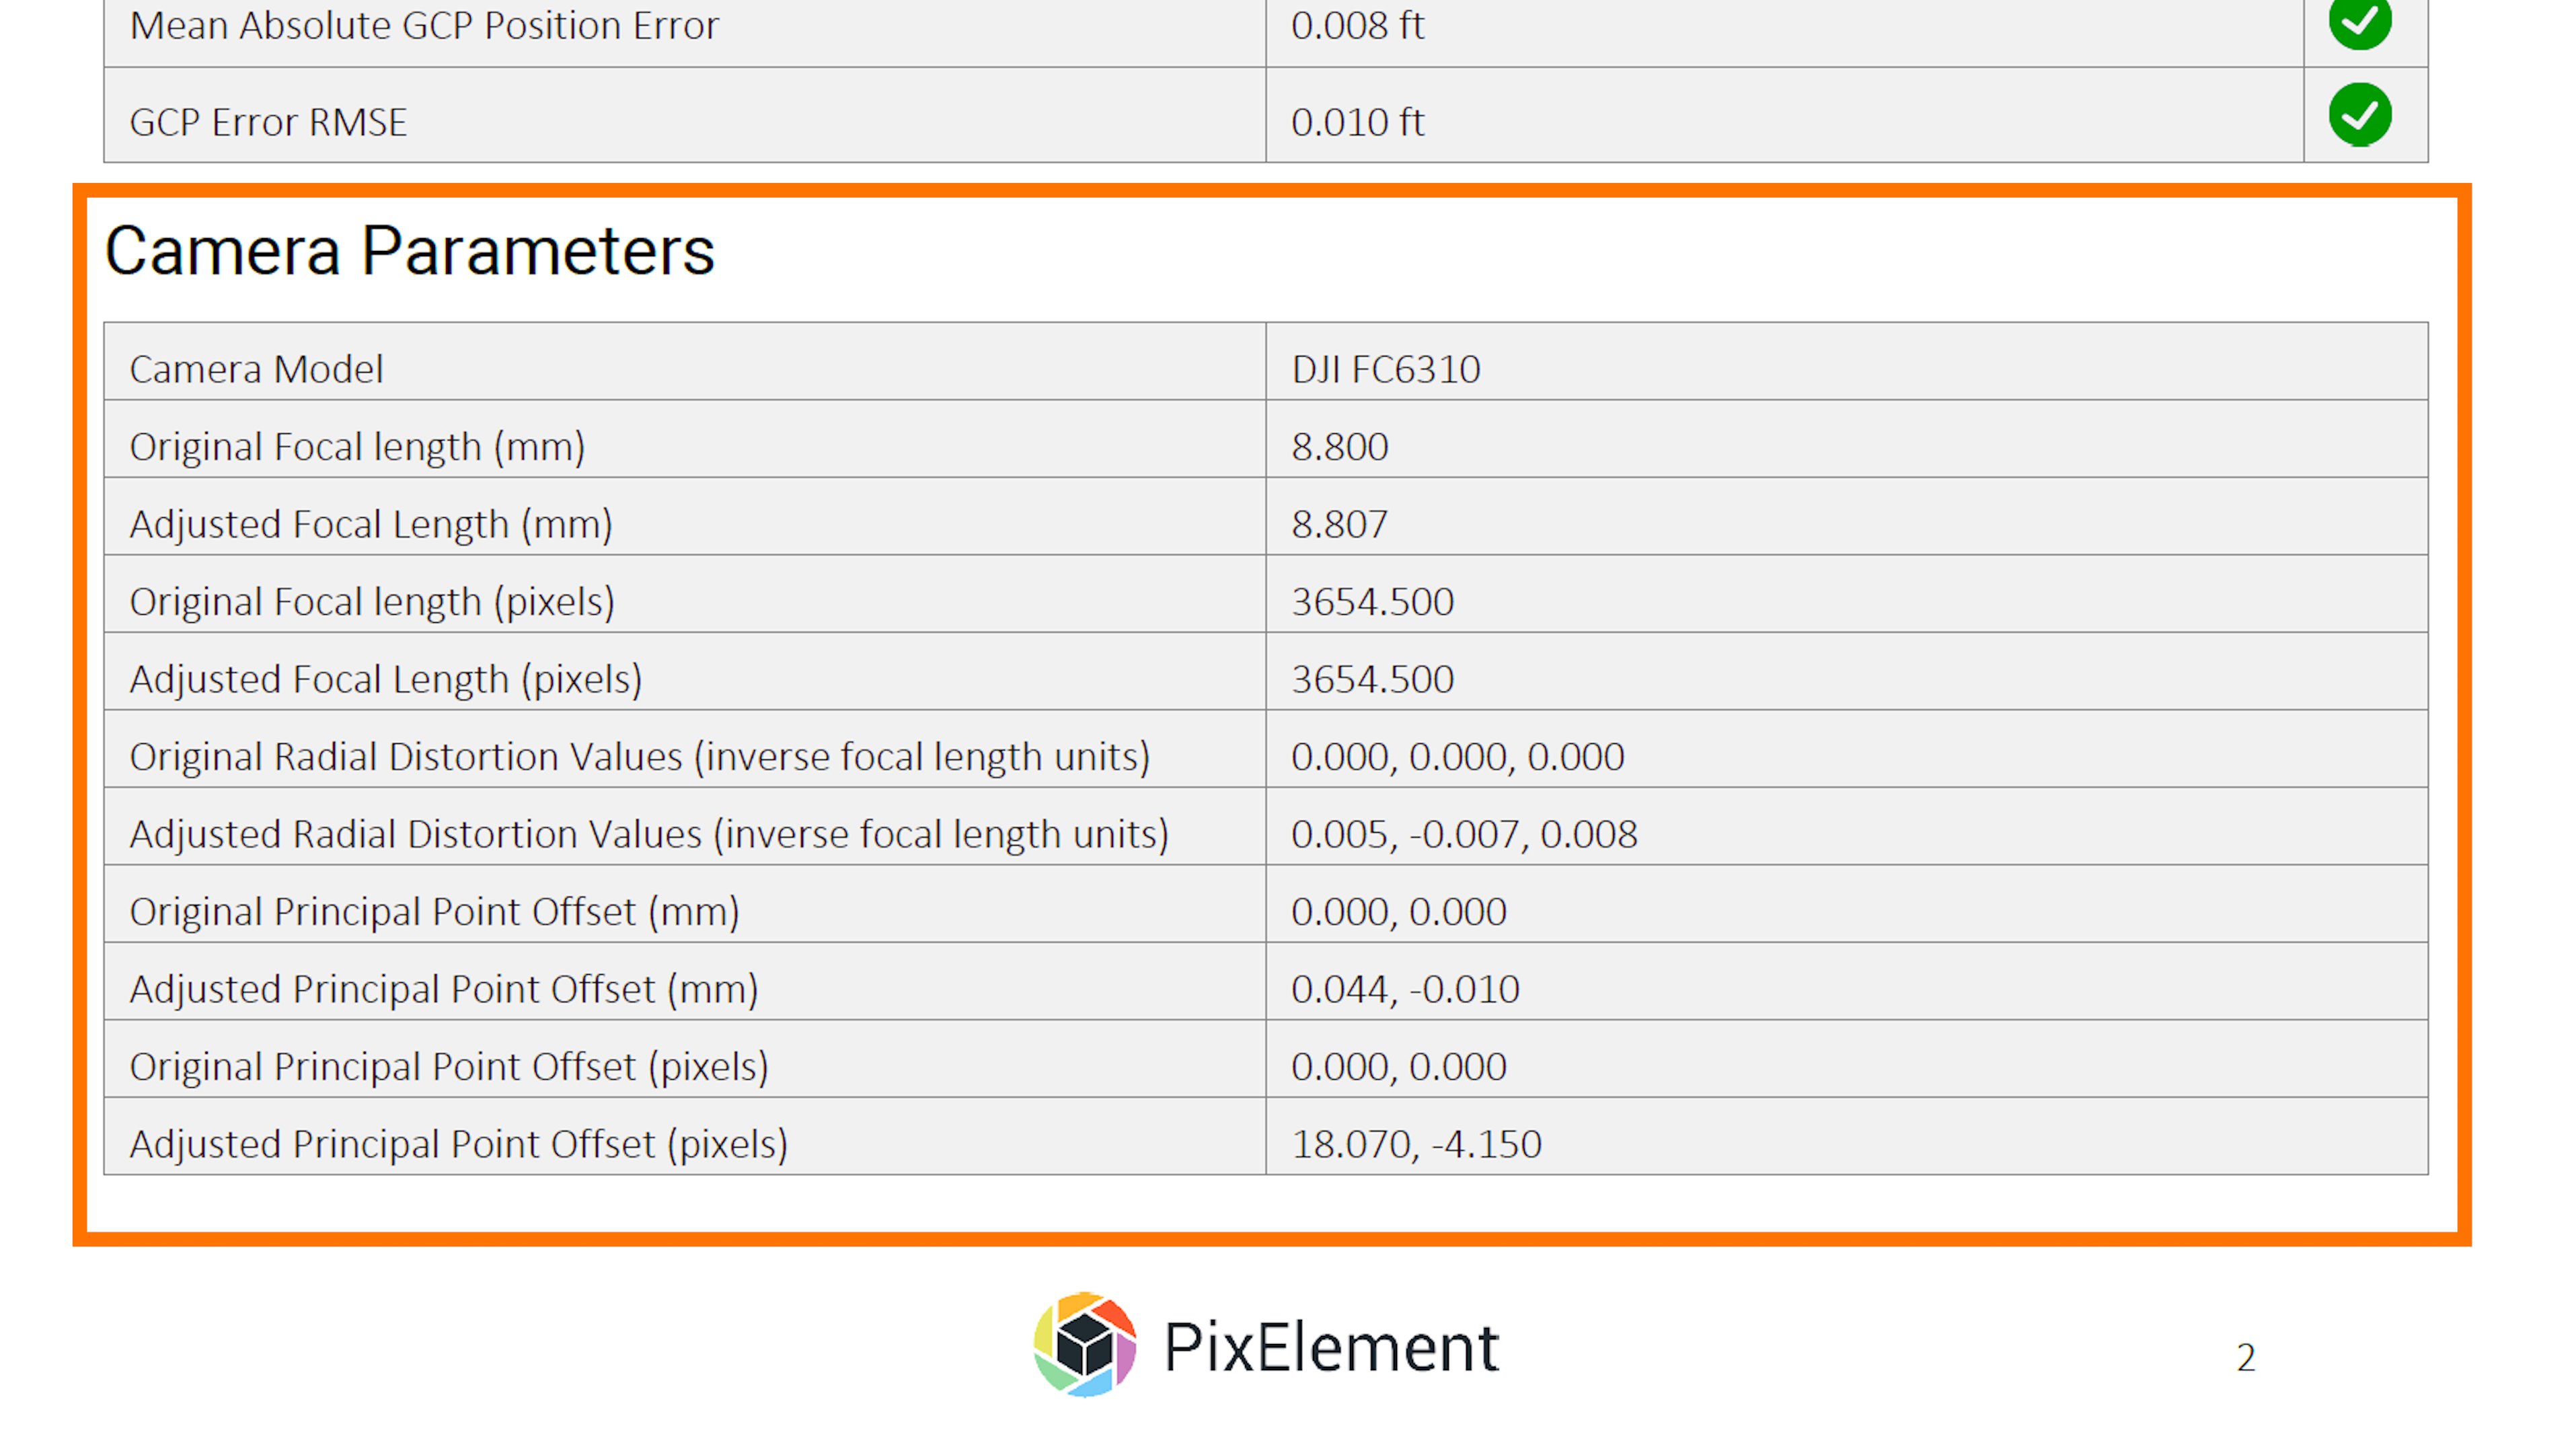
The camera parameters section tells you information all about the camera that shot your project. We get the camera model, original focal length and adjusted focal length in millimeters and pixels, original and adjusted radial distortion values, and original and adjusted principal point offset in both millimeters and pixels.
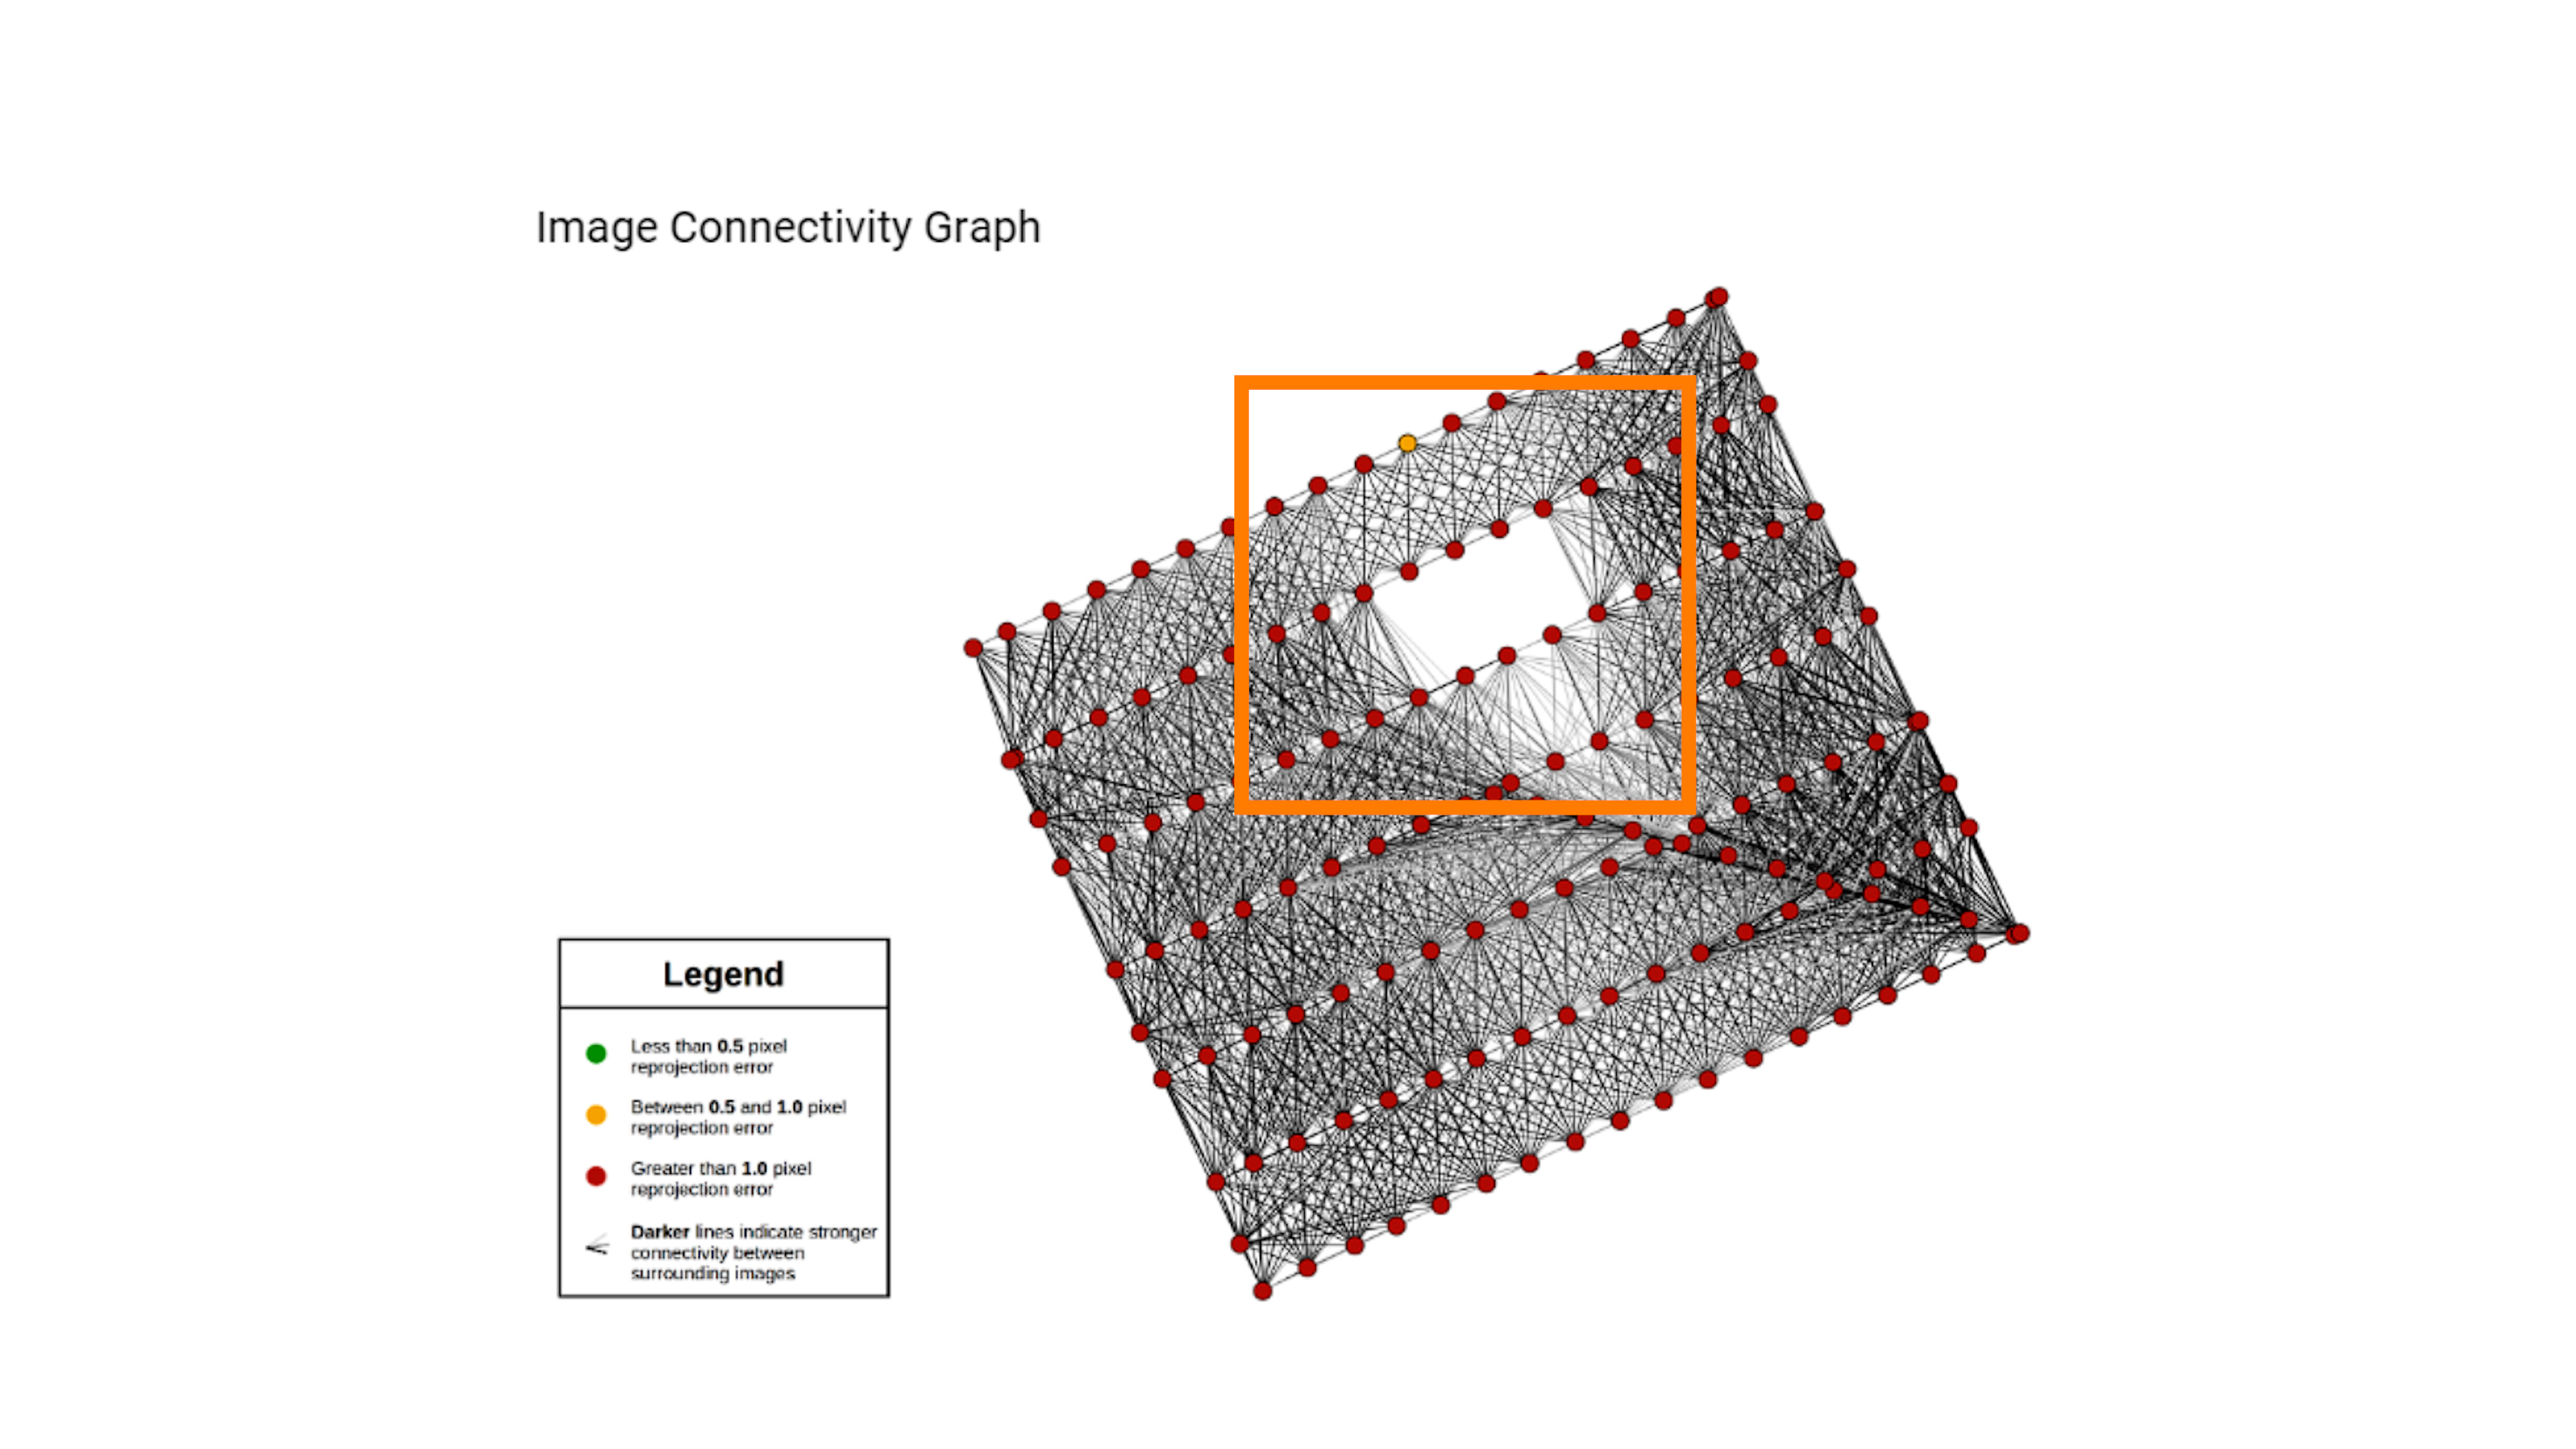
Image Connectivity Graph
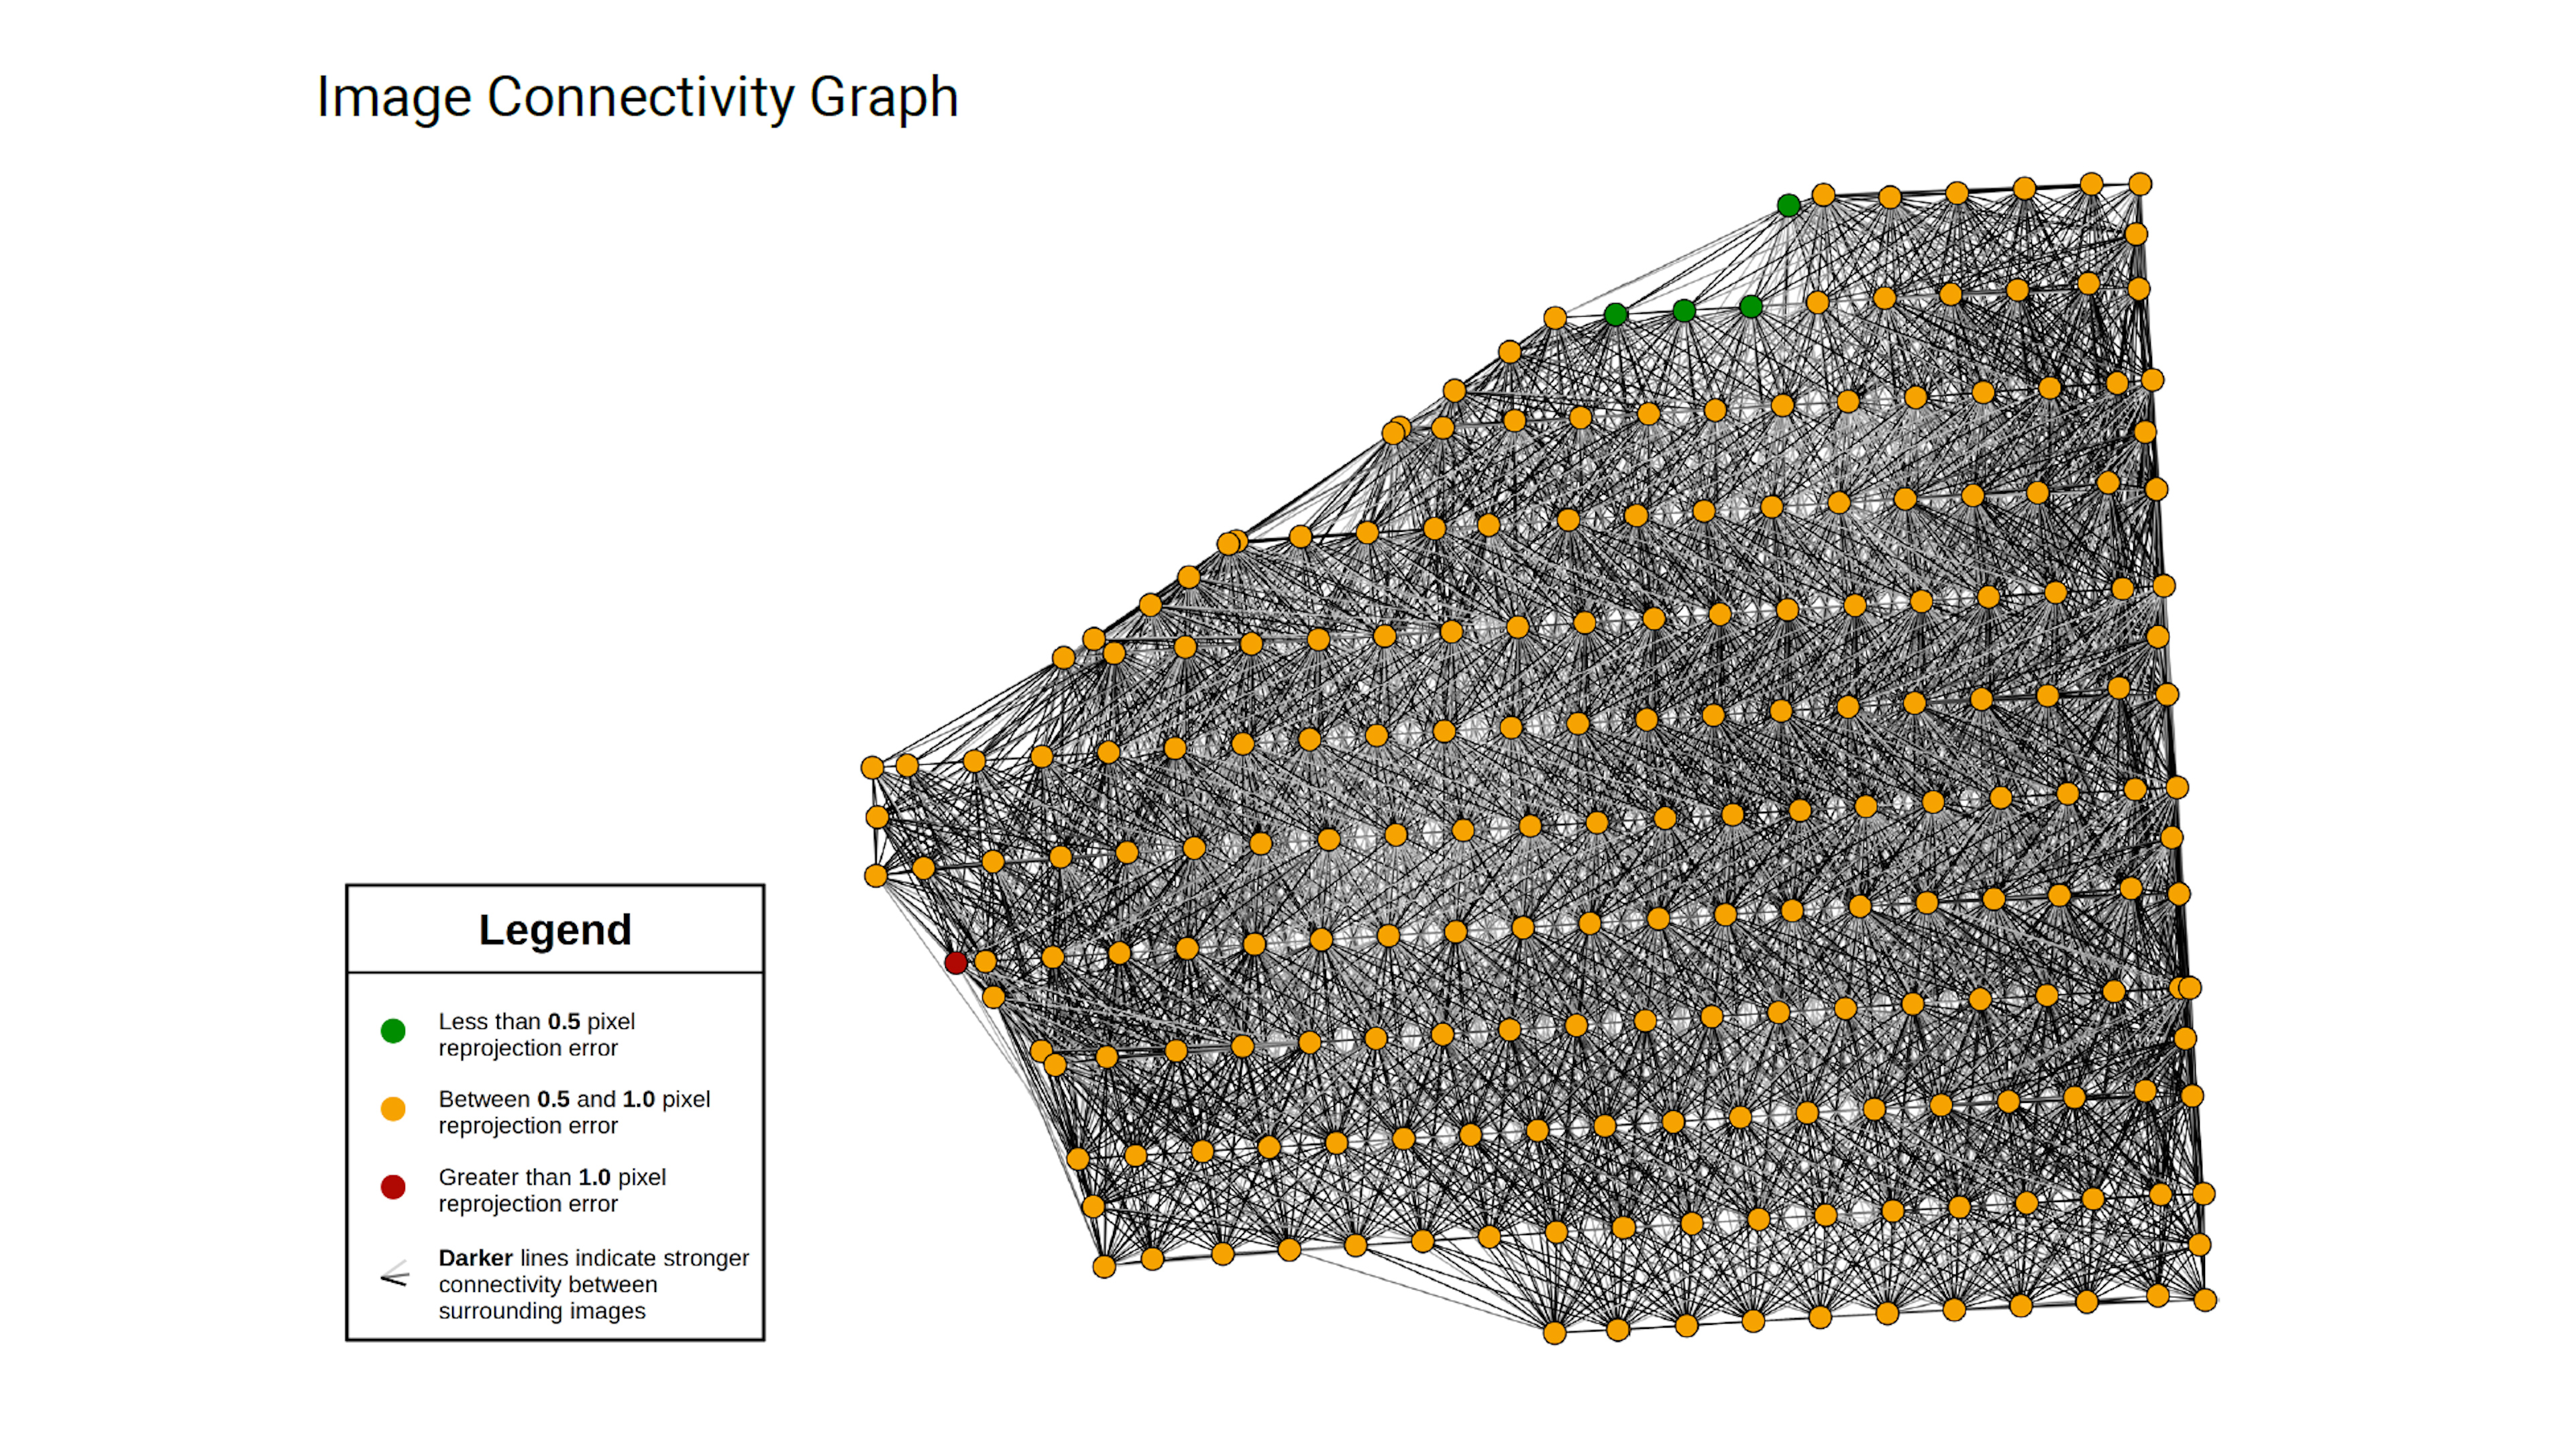
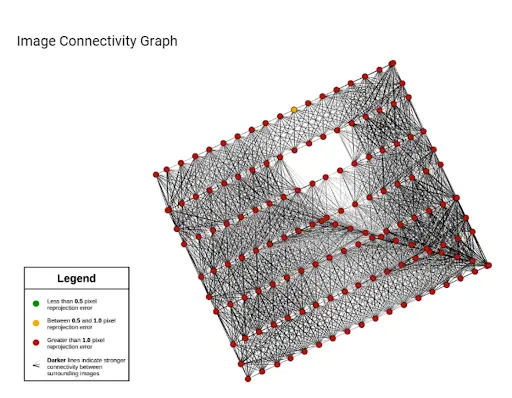
This graph is a representation of the spatial relationships between the overlapping aerial images captured by your aerial system. Each image is represented as a node in the graph, and edges between nodes indicate spatial connections or overlaps between the corresponding images. Nodes are then measured by their reprojection error and symbolized as green, yellow and red. This graph is crucial for tasks such as image matching, bundle adjustment, and generating accurate terrain models, as it helps visualize and analyze how images relate to one another, facilitating efficient processing and extraction of valuable geospatial information from the imagery. The more images you have, the smaller the nodes will be.
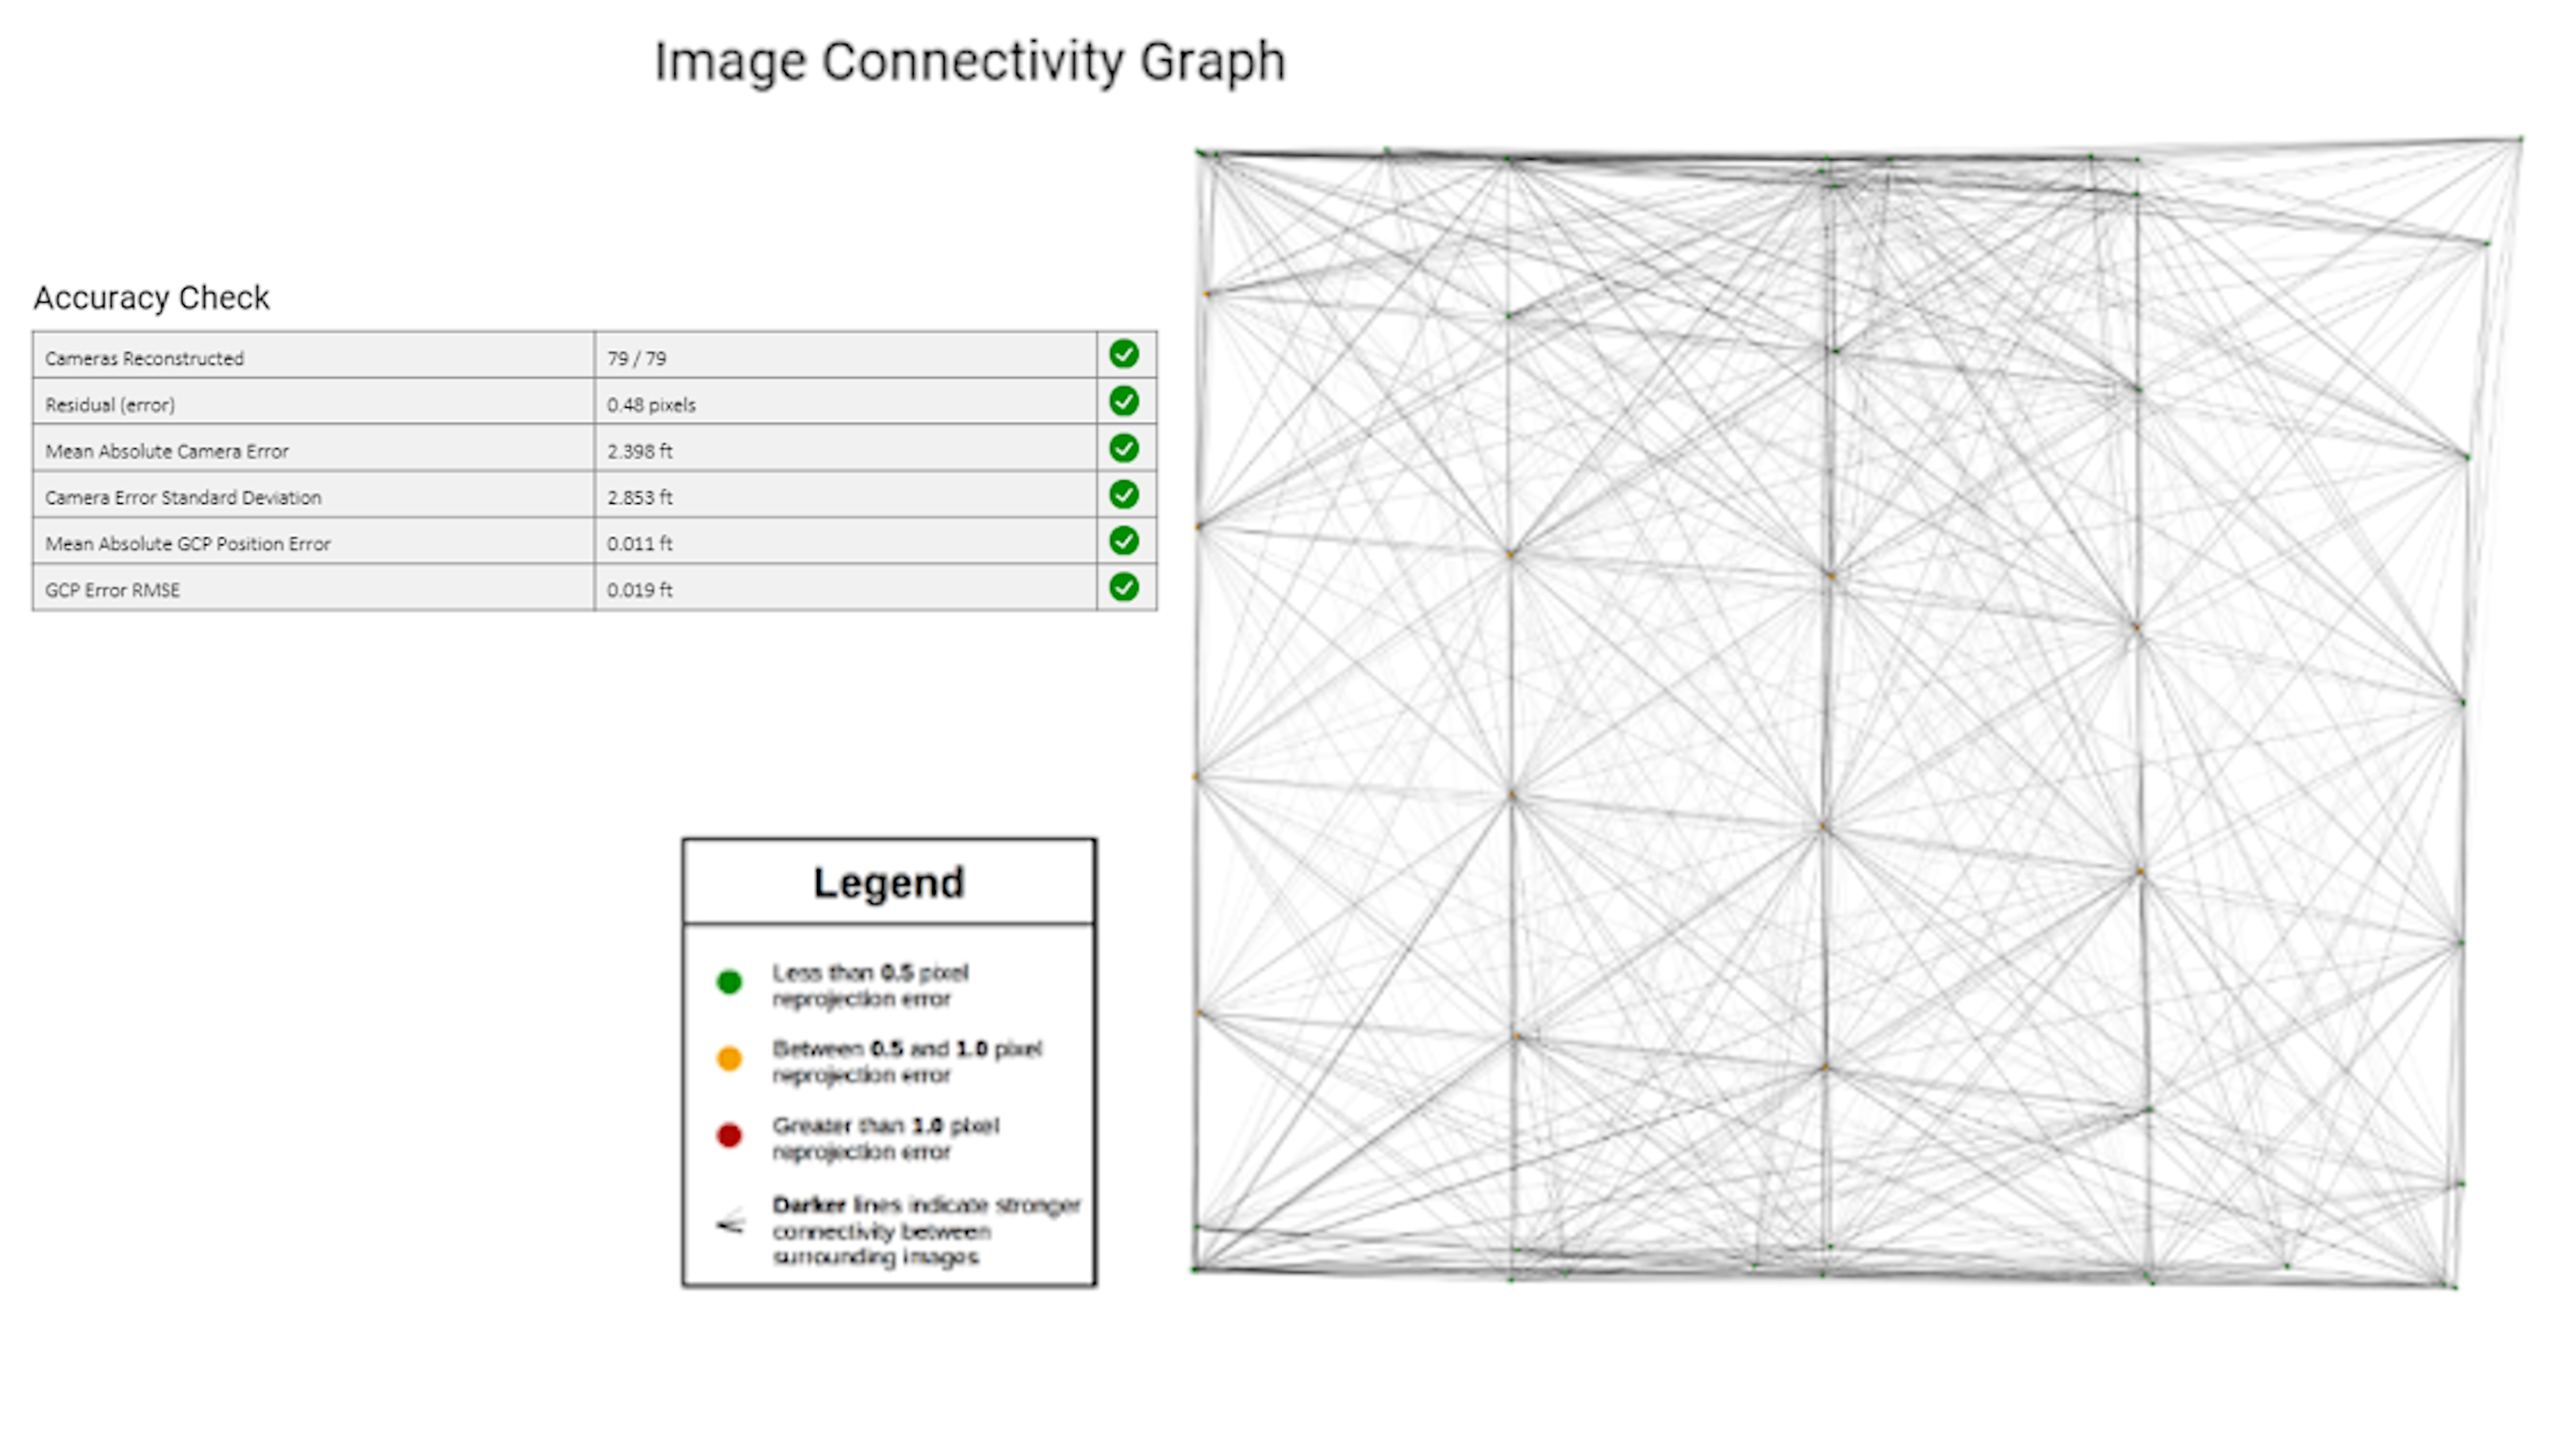
An example of a good image connectivity graph looks the image above - you have a relatively equal grid flightpath and all of your parameters are green.
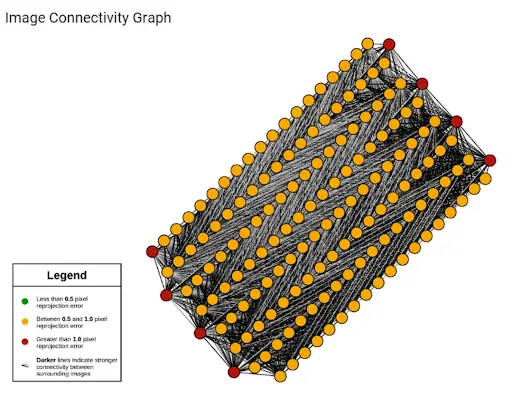
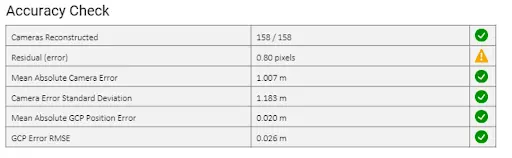
An example of an adequate graph could be the image above - you have an equal grid, primarily yellow, and maybe some red. Your reprojection error is a bit higher. You will likely have a successful model, but there are some things you could improve upon. In this model’s case, the residual error is elevated and we have some quite high reprojection errors, especially on the edges, which could lead to some rough edges. In this dataset, lighting is also possibly playing a factor as there are long shadows and a majority of the dataset is not in direct sunlight.
An example of a very high reprojection error graph, and therefore inadequate, could look like the project pictured above. The main problem here is a very high residual error which results in a very high reprojection error.
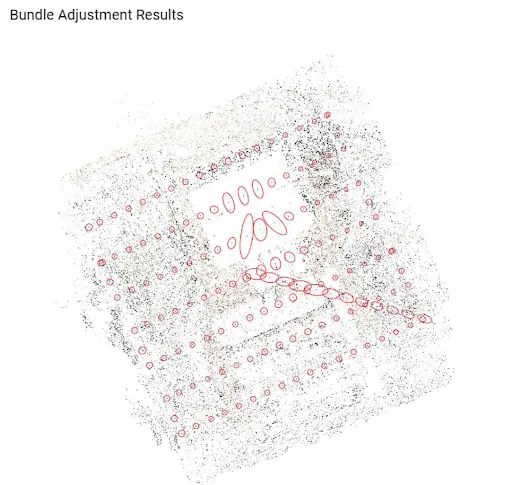
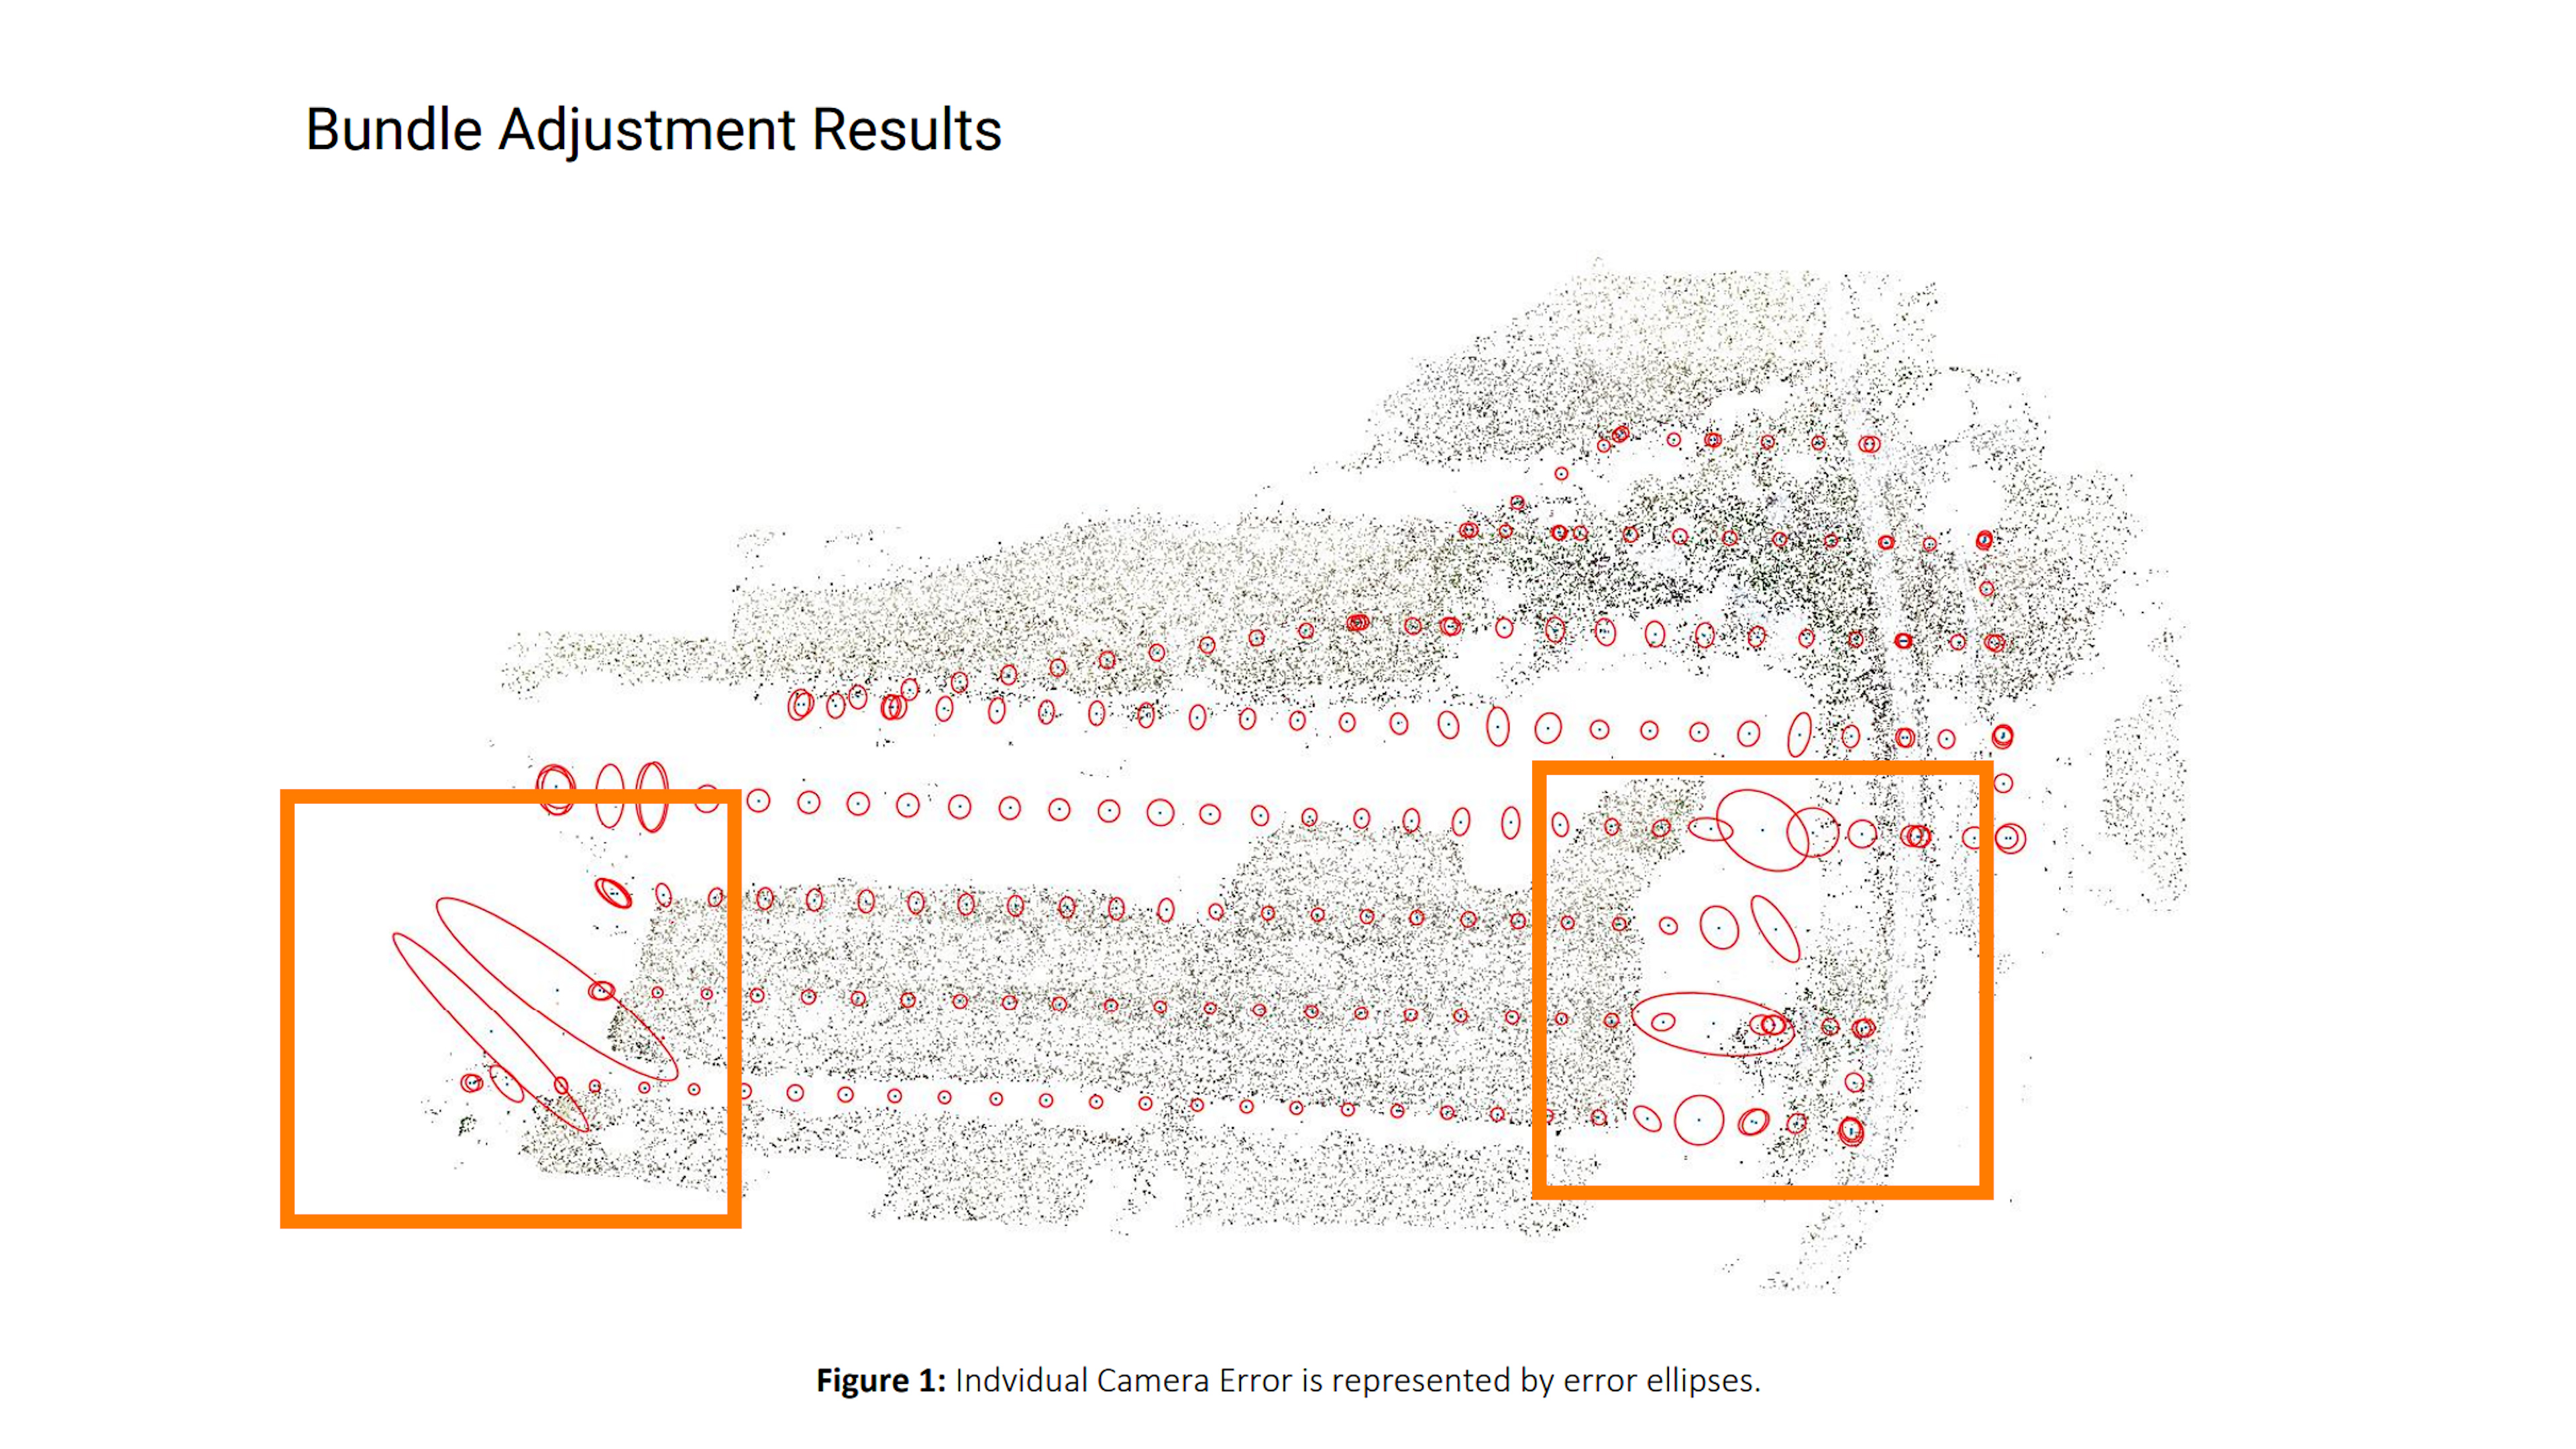
Bundle Adjustment Results
This shows the error ellipses associated with the least squares optimization process. Error ellipses are used to represent the positional uncertainty of the adjusted horizontal coordinates of the estimated camera positions. You can evaluate the quality of the adjustment by looking at the shape and the size of the error ellipses. The smaller and rounder the error ellipse, the more reliable the adjusted coordinates are for the camera locations. Larger and more oblong shapes indicate increased variance (uncertainty). This graph summarizes the optimization process applied to adjust the parameters of the camera and orientation of images in a photogrammetric project.
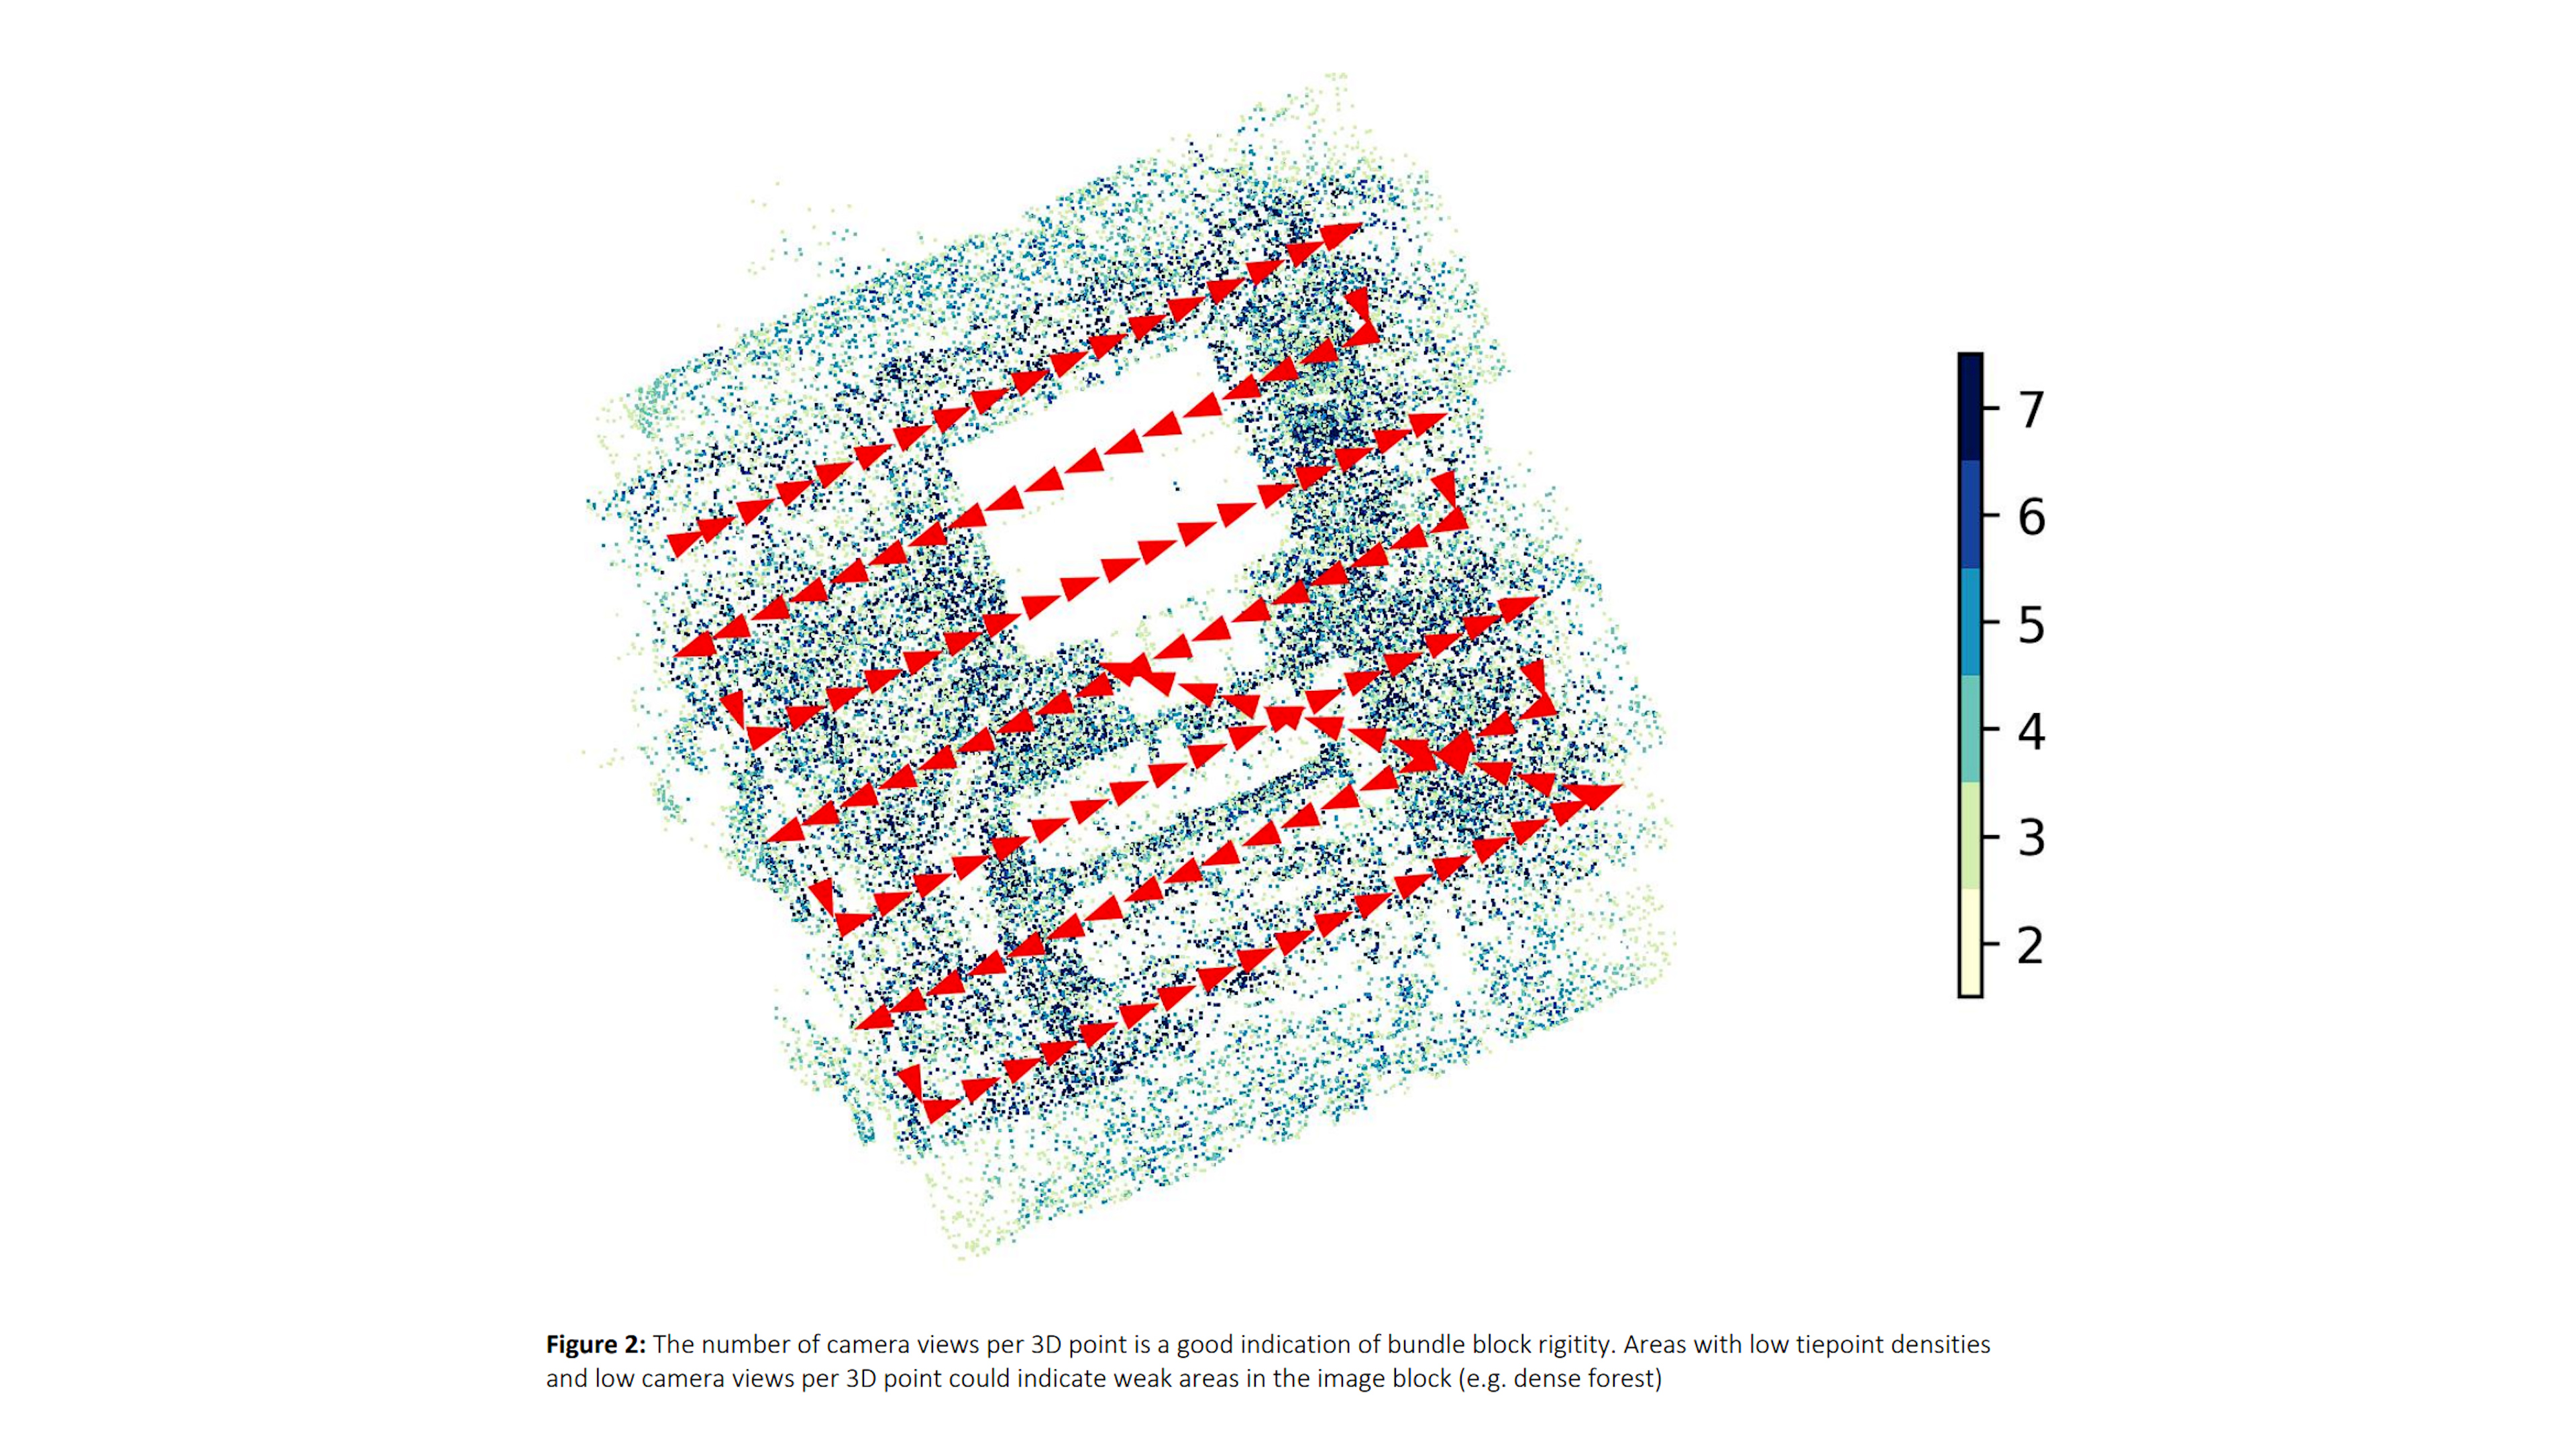
Looking at the problematic dataset we just looked at previously, the Bundle Adjustment Results show that there were issues of uncertainty surrounding the building in this project, as it has a metal roof and is shiny, this is visible in the Image Connectivity Graph as well. On the graph we can see the circles where the building is becoming more oval shaped showing the impact of the reflection of the roof and the increased uncertainty associated with that in the bundle adjustment process. The second figure we are given shows us the number of camera views and the path the drone took. We can see that there are weak areas, especially where the building with the metallic reflective roof is located.
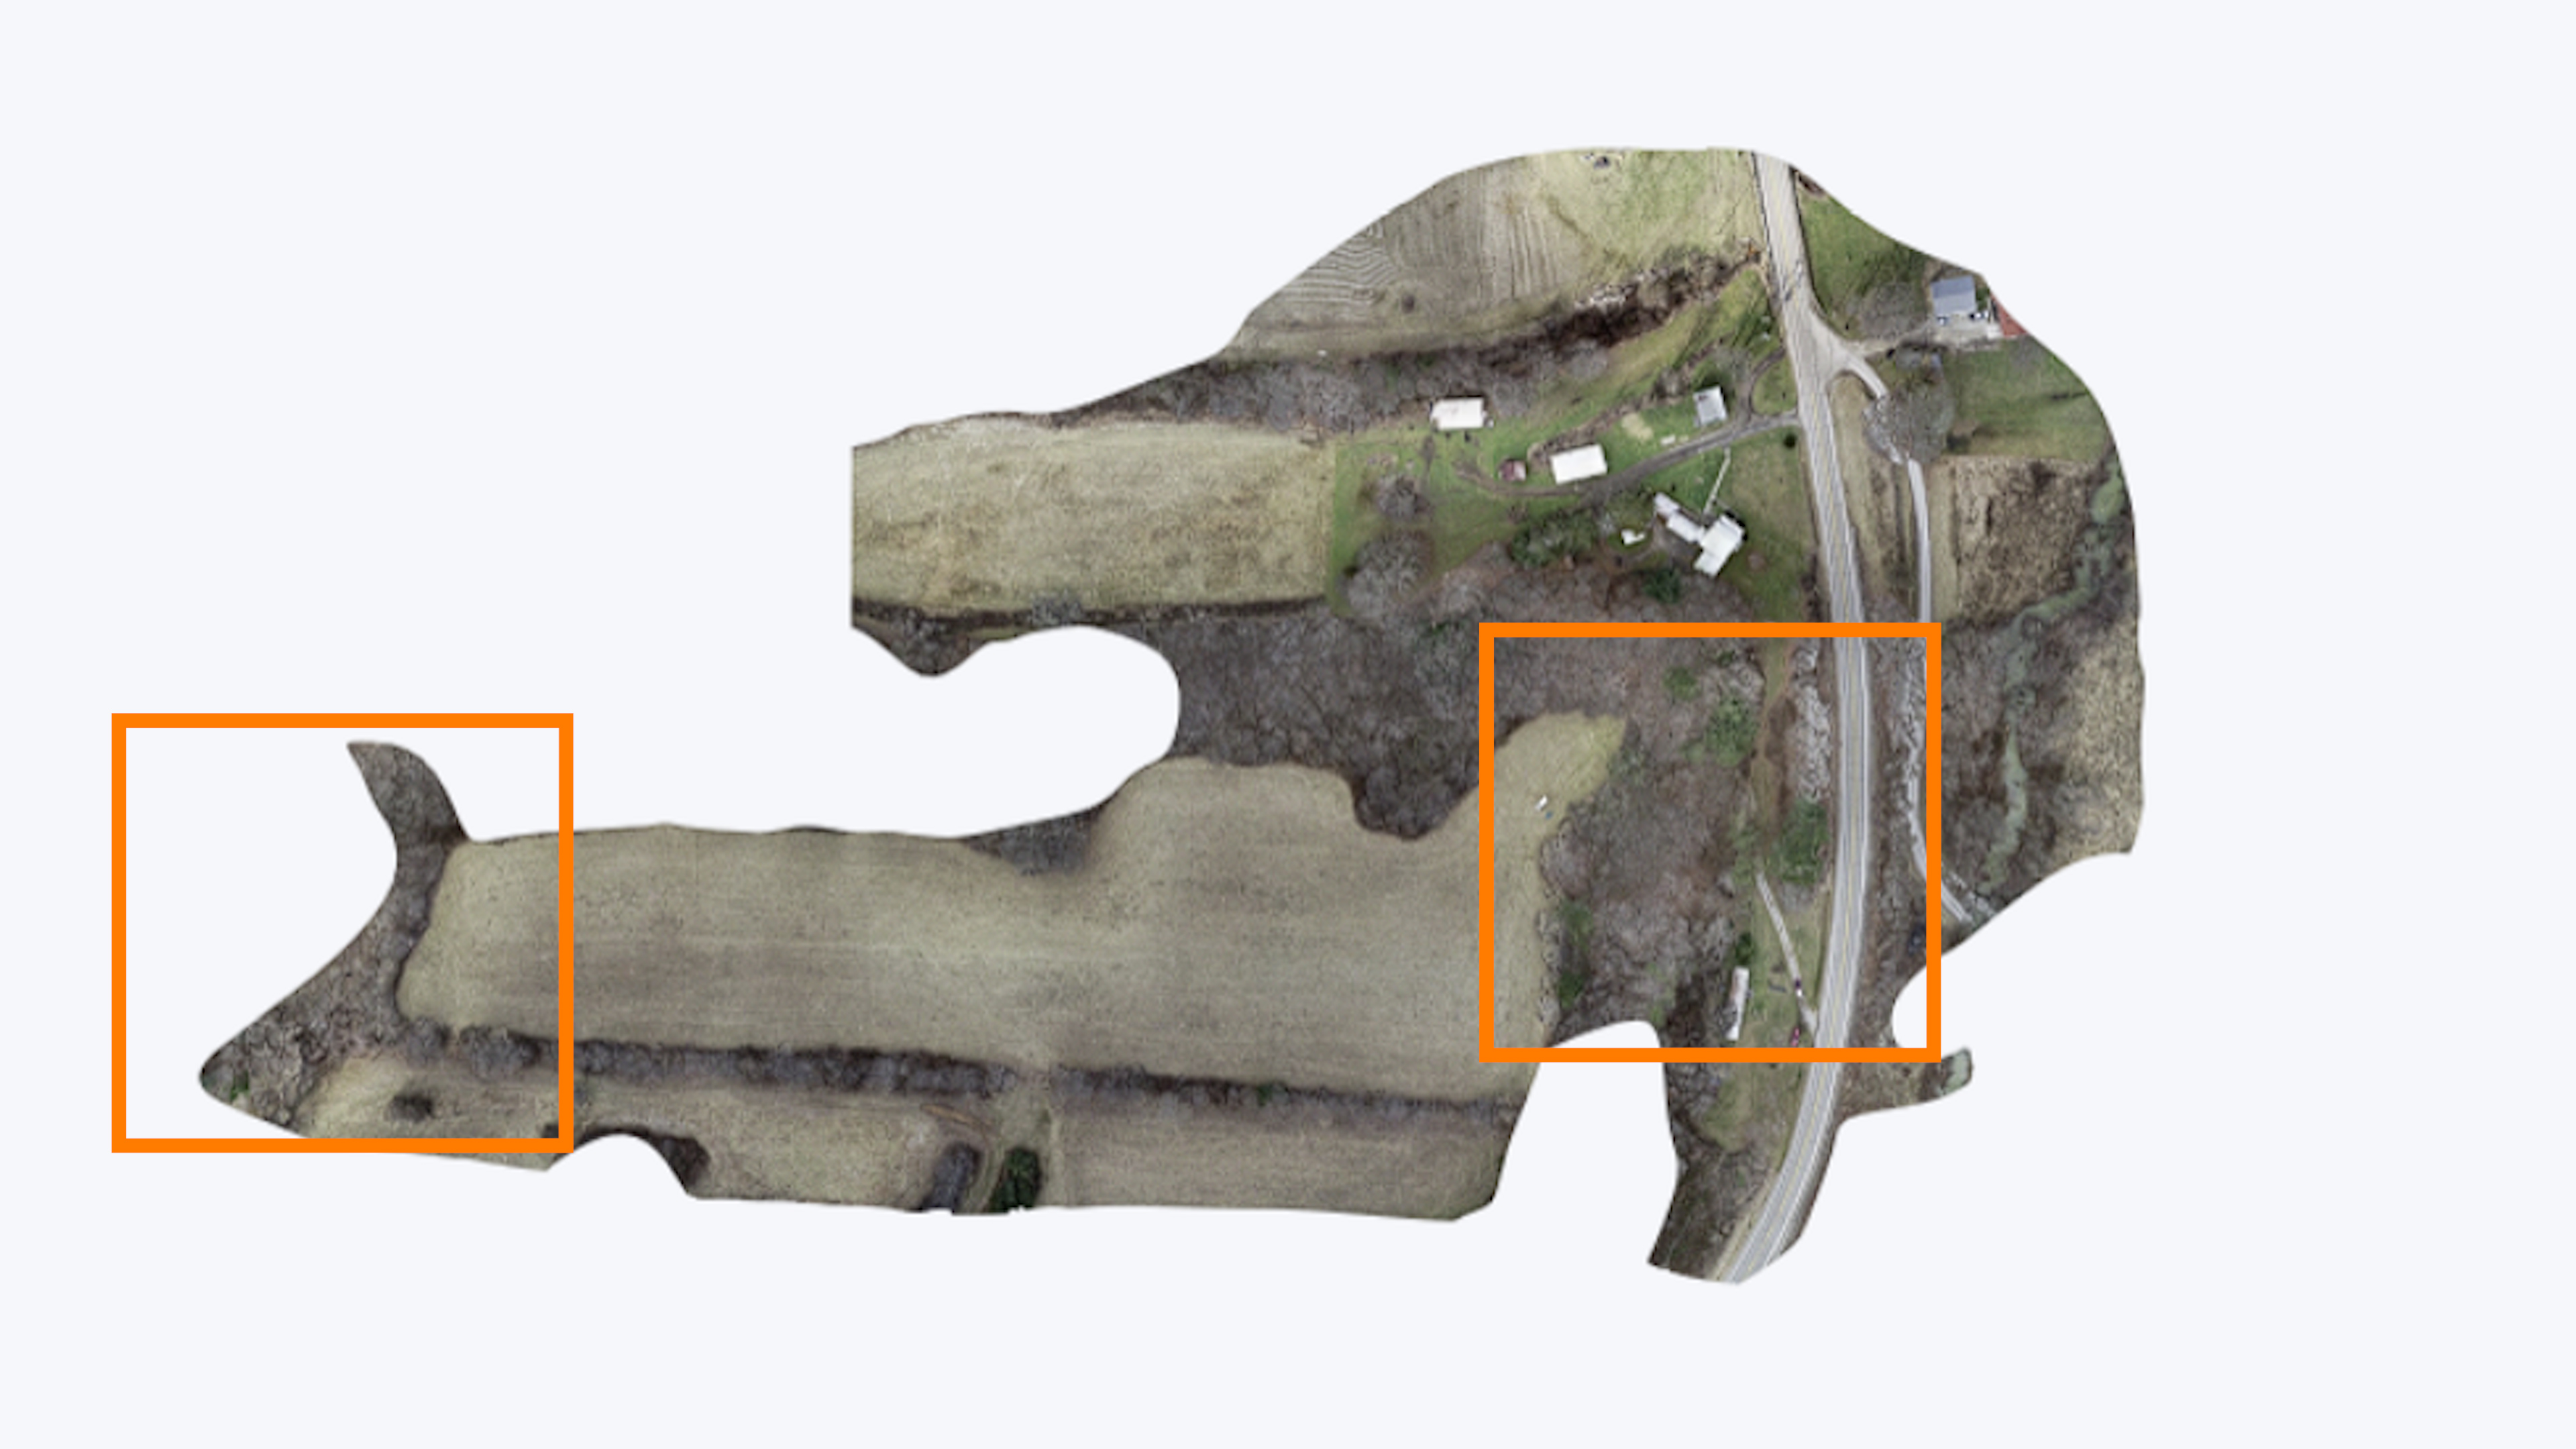
The next example is a LiDAR dataset of a field with some dense forest areas around it. In the bottom left you can see large ovals as well as some over on the right. We can see that they are densely forested areas and were not picked up very well which created some uncertainty. Crossreferencing with the orthomosaic, we can confirm it is because of the dense trees.
Camera and Reference Point Position Accuracy
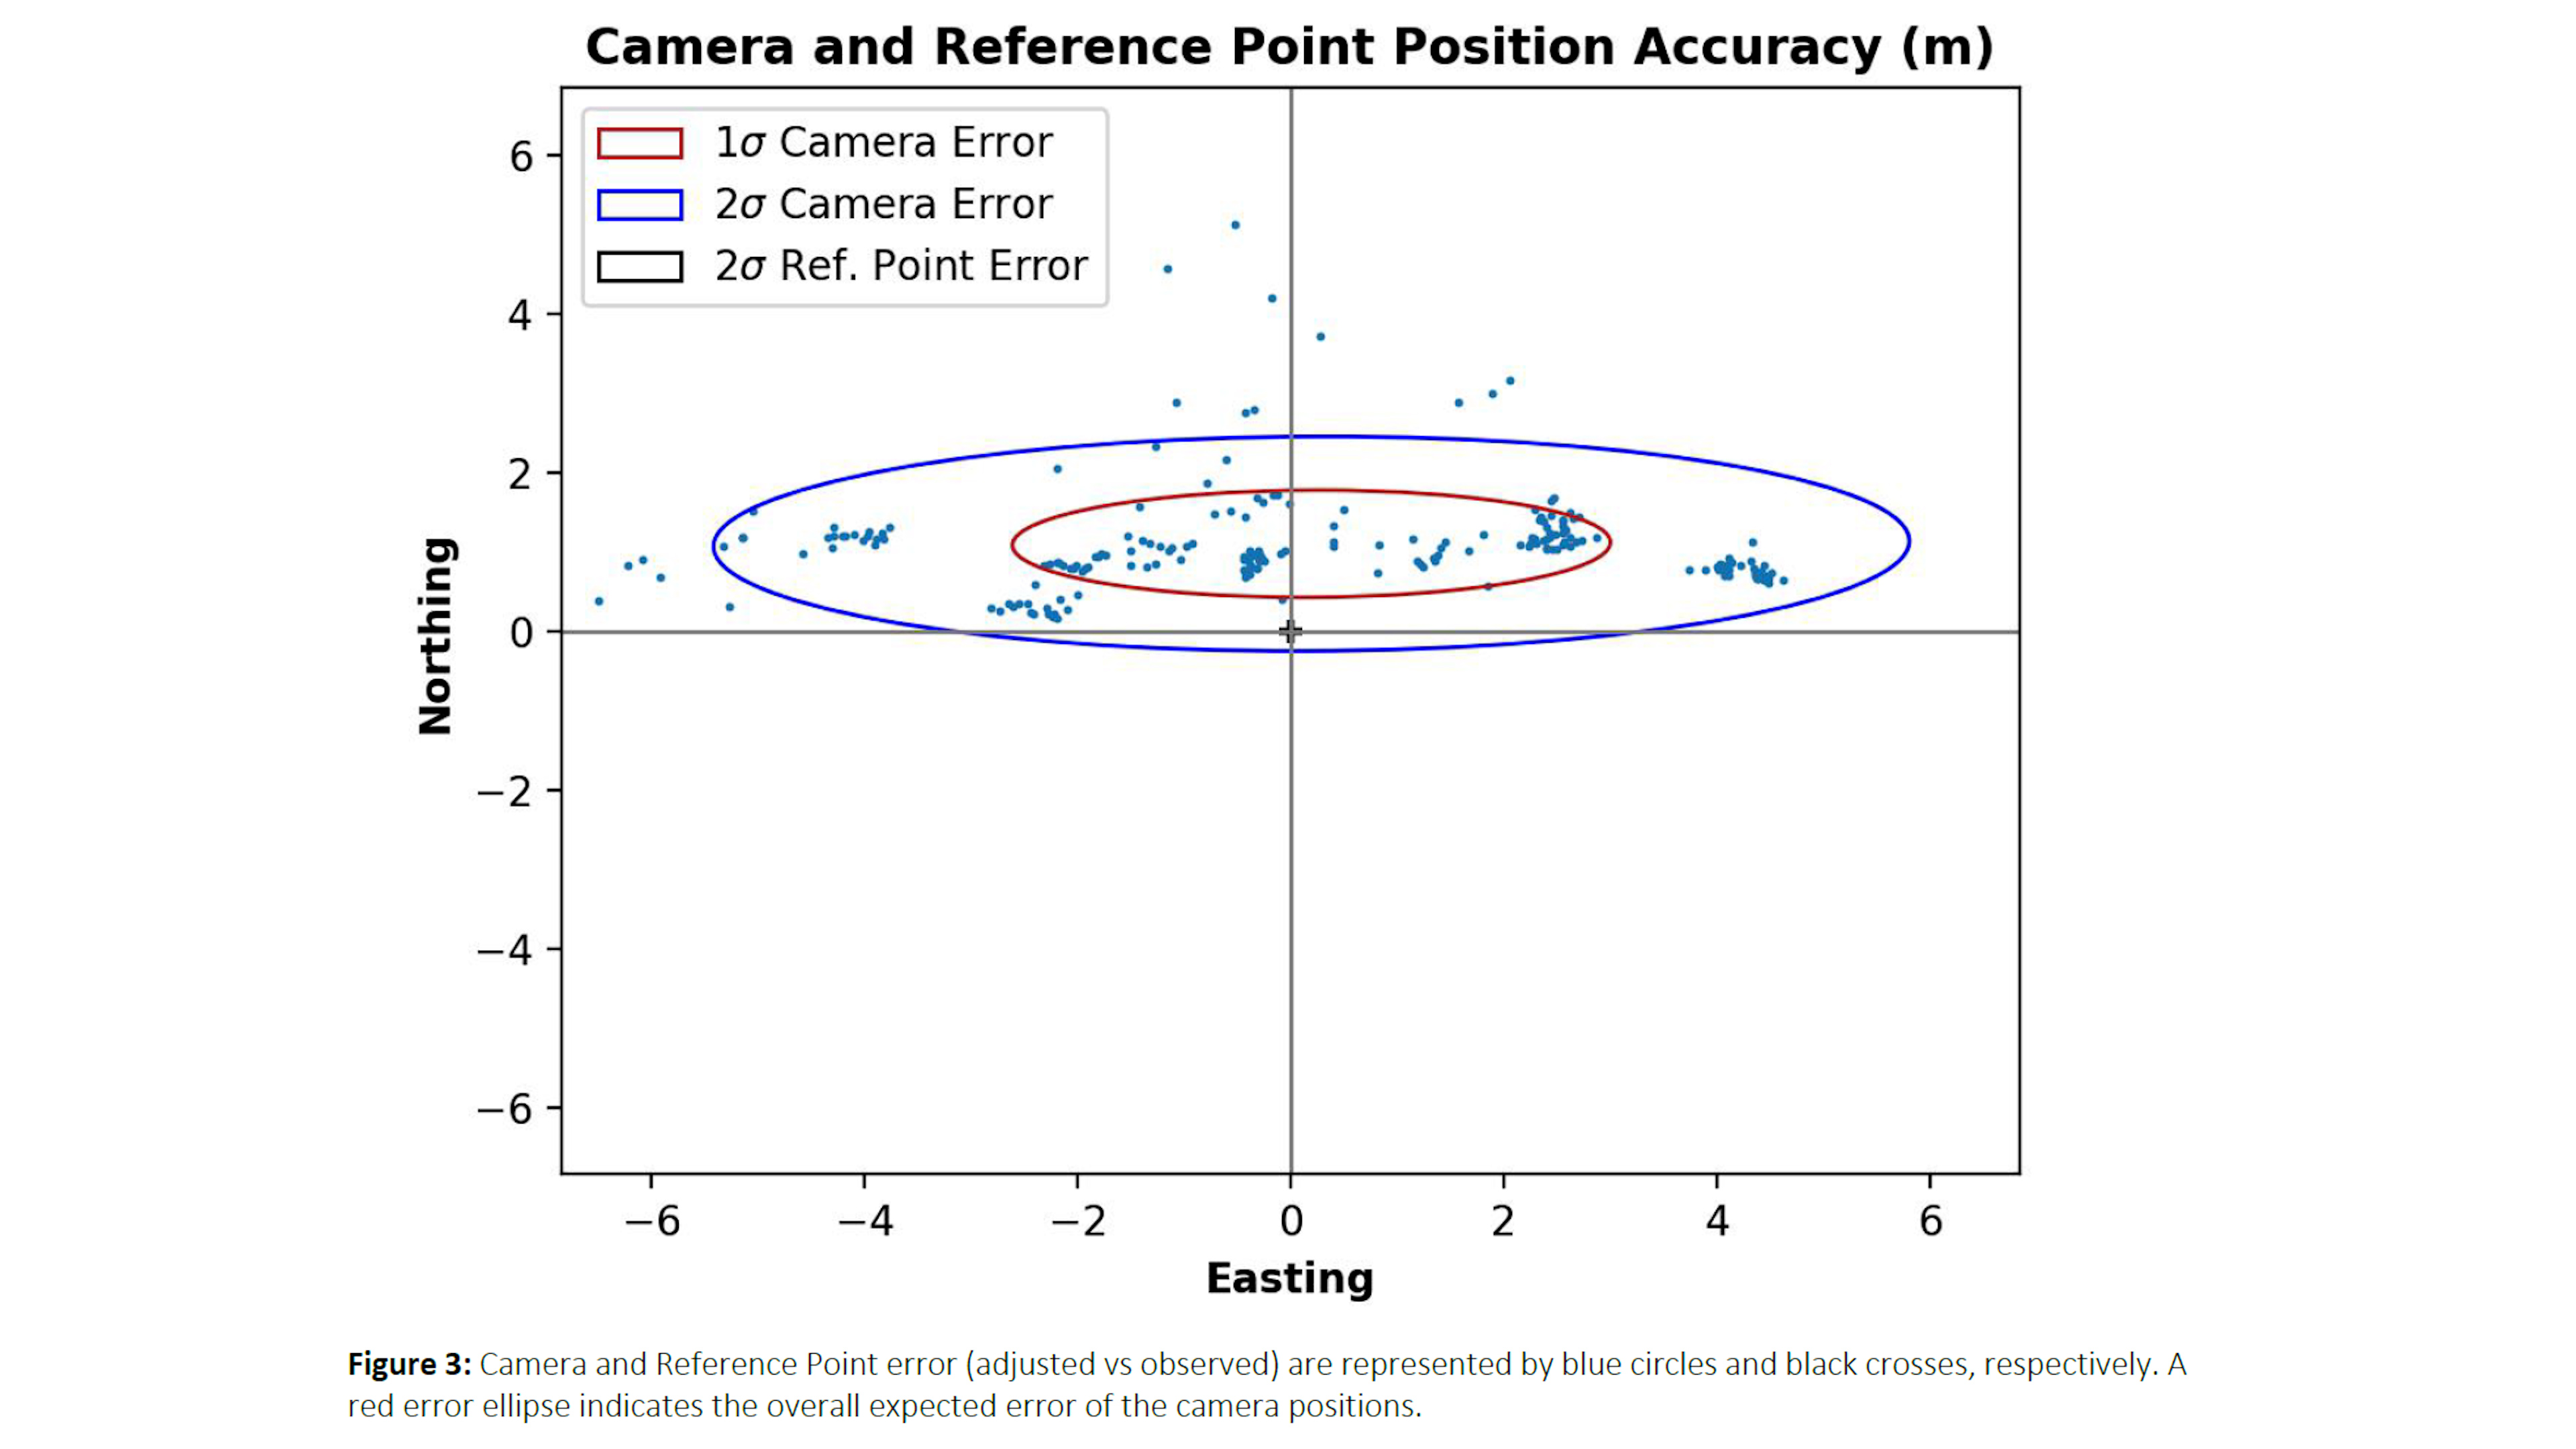
The Camera and Reference Point Position Accuracy graph displays the precision of camera positions and reference points in terms of their northing and easting coordinates. It helps assess the reliability of spatial positioning, ensuring accurate alignment of aerial images for photogrammetric processing. This graph is vital for verifying the consistency and reliability of georeferencing information, ultimately enhancing the accuracy of generated maps or models from aerial imagery.
Reprojection Error Graphs for Columns and Rows
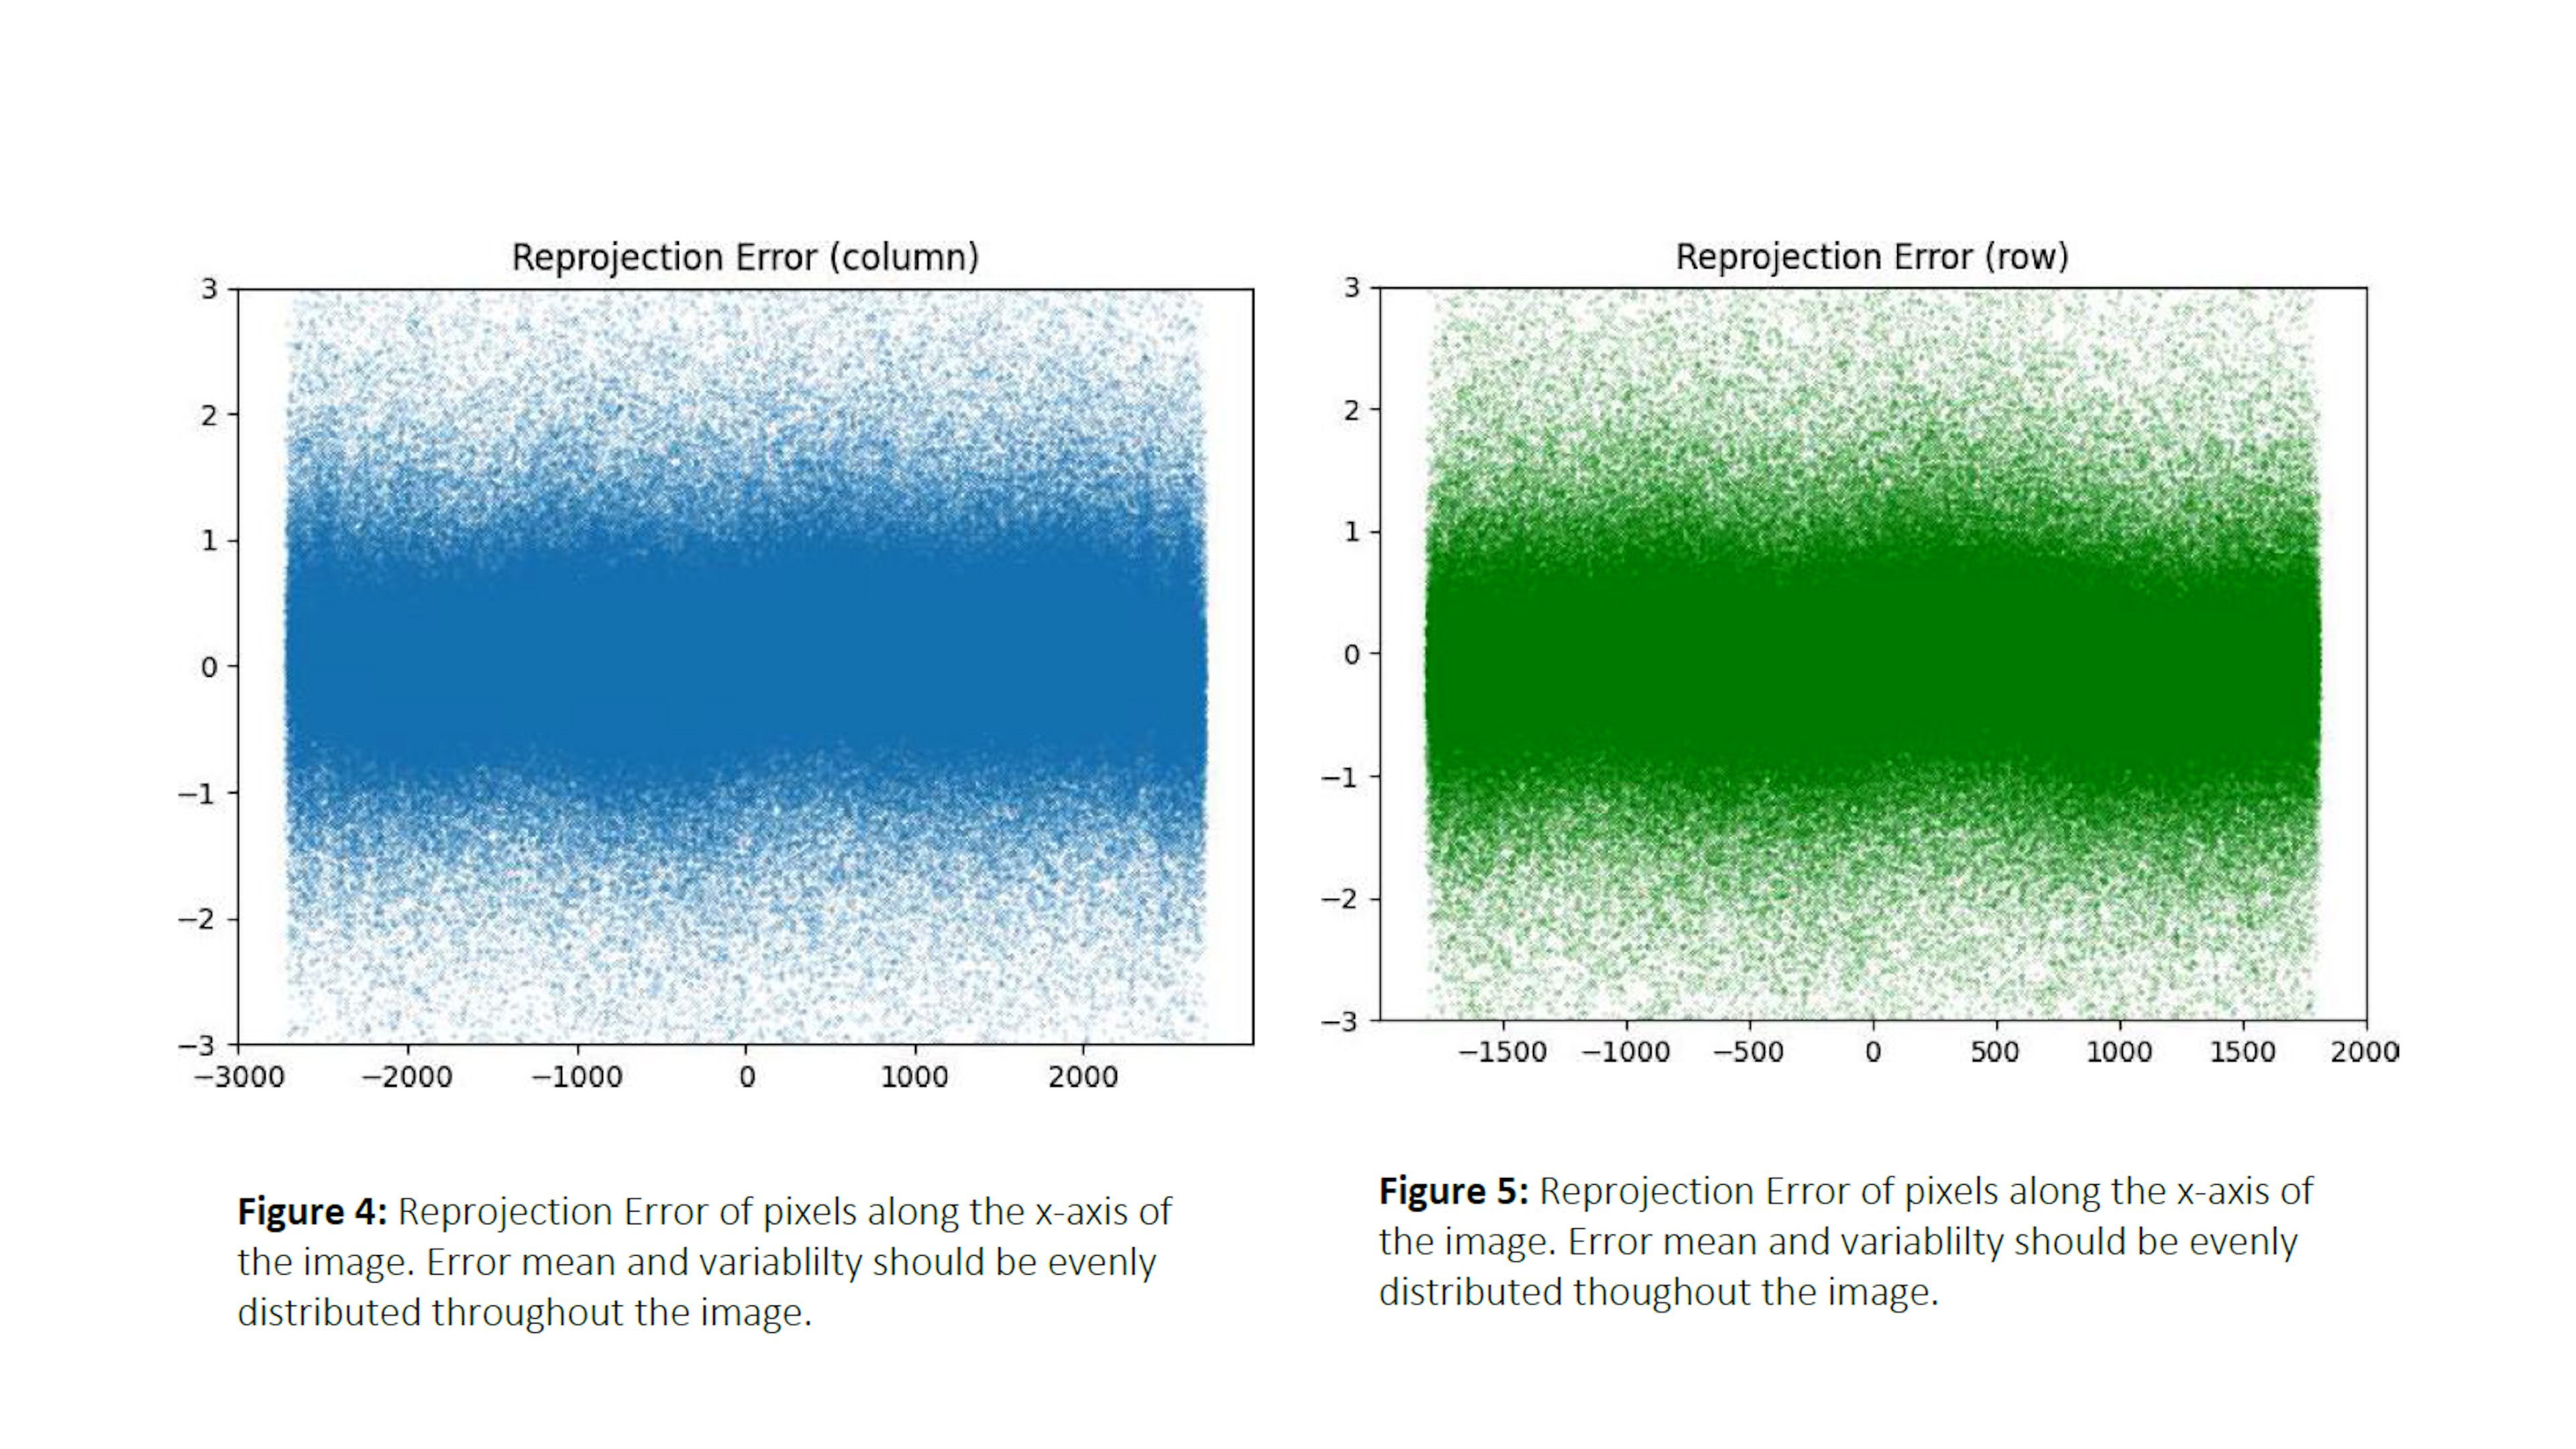
While both graphs evaluate reprojection errors in aerial photogrammetry, the column graph focuses on errors along horizontal lines, while the row graph focuses on errors along vertical lines. Analyzing both graphs helps identify and address specific issues affecting the accuracy of the photogrammetric reconstruction process, leading to more reliable results. These may help point to problems with camera calibration, image distortion, or errors in the orientation parameters.
Pixel Observation Distribution & Reprojection Error Variablility
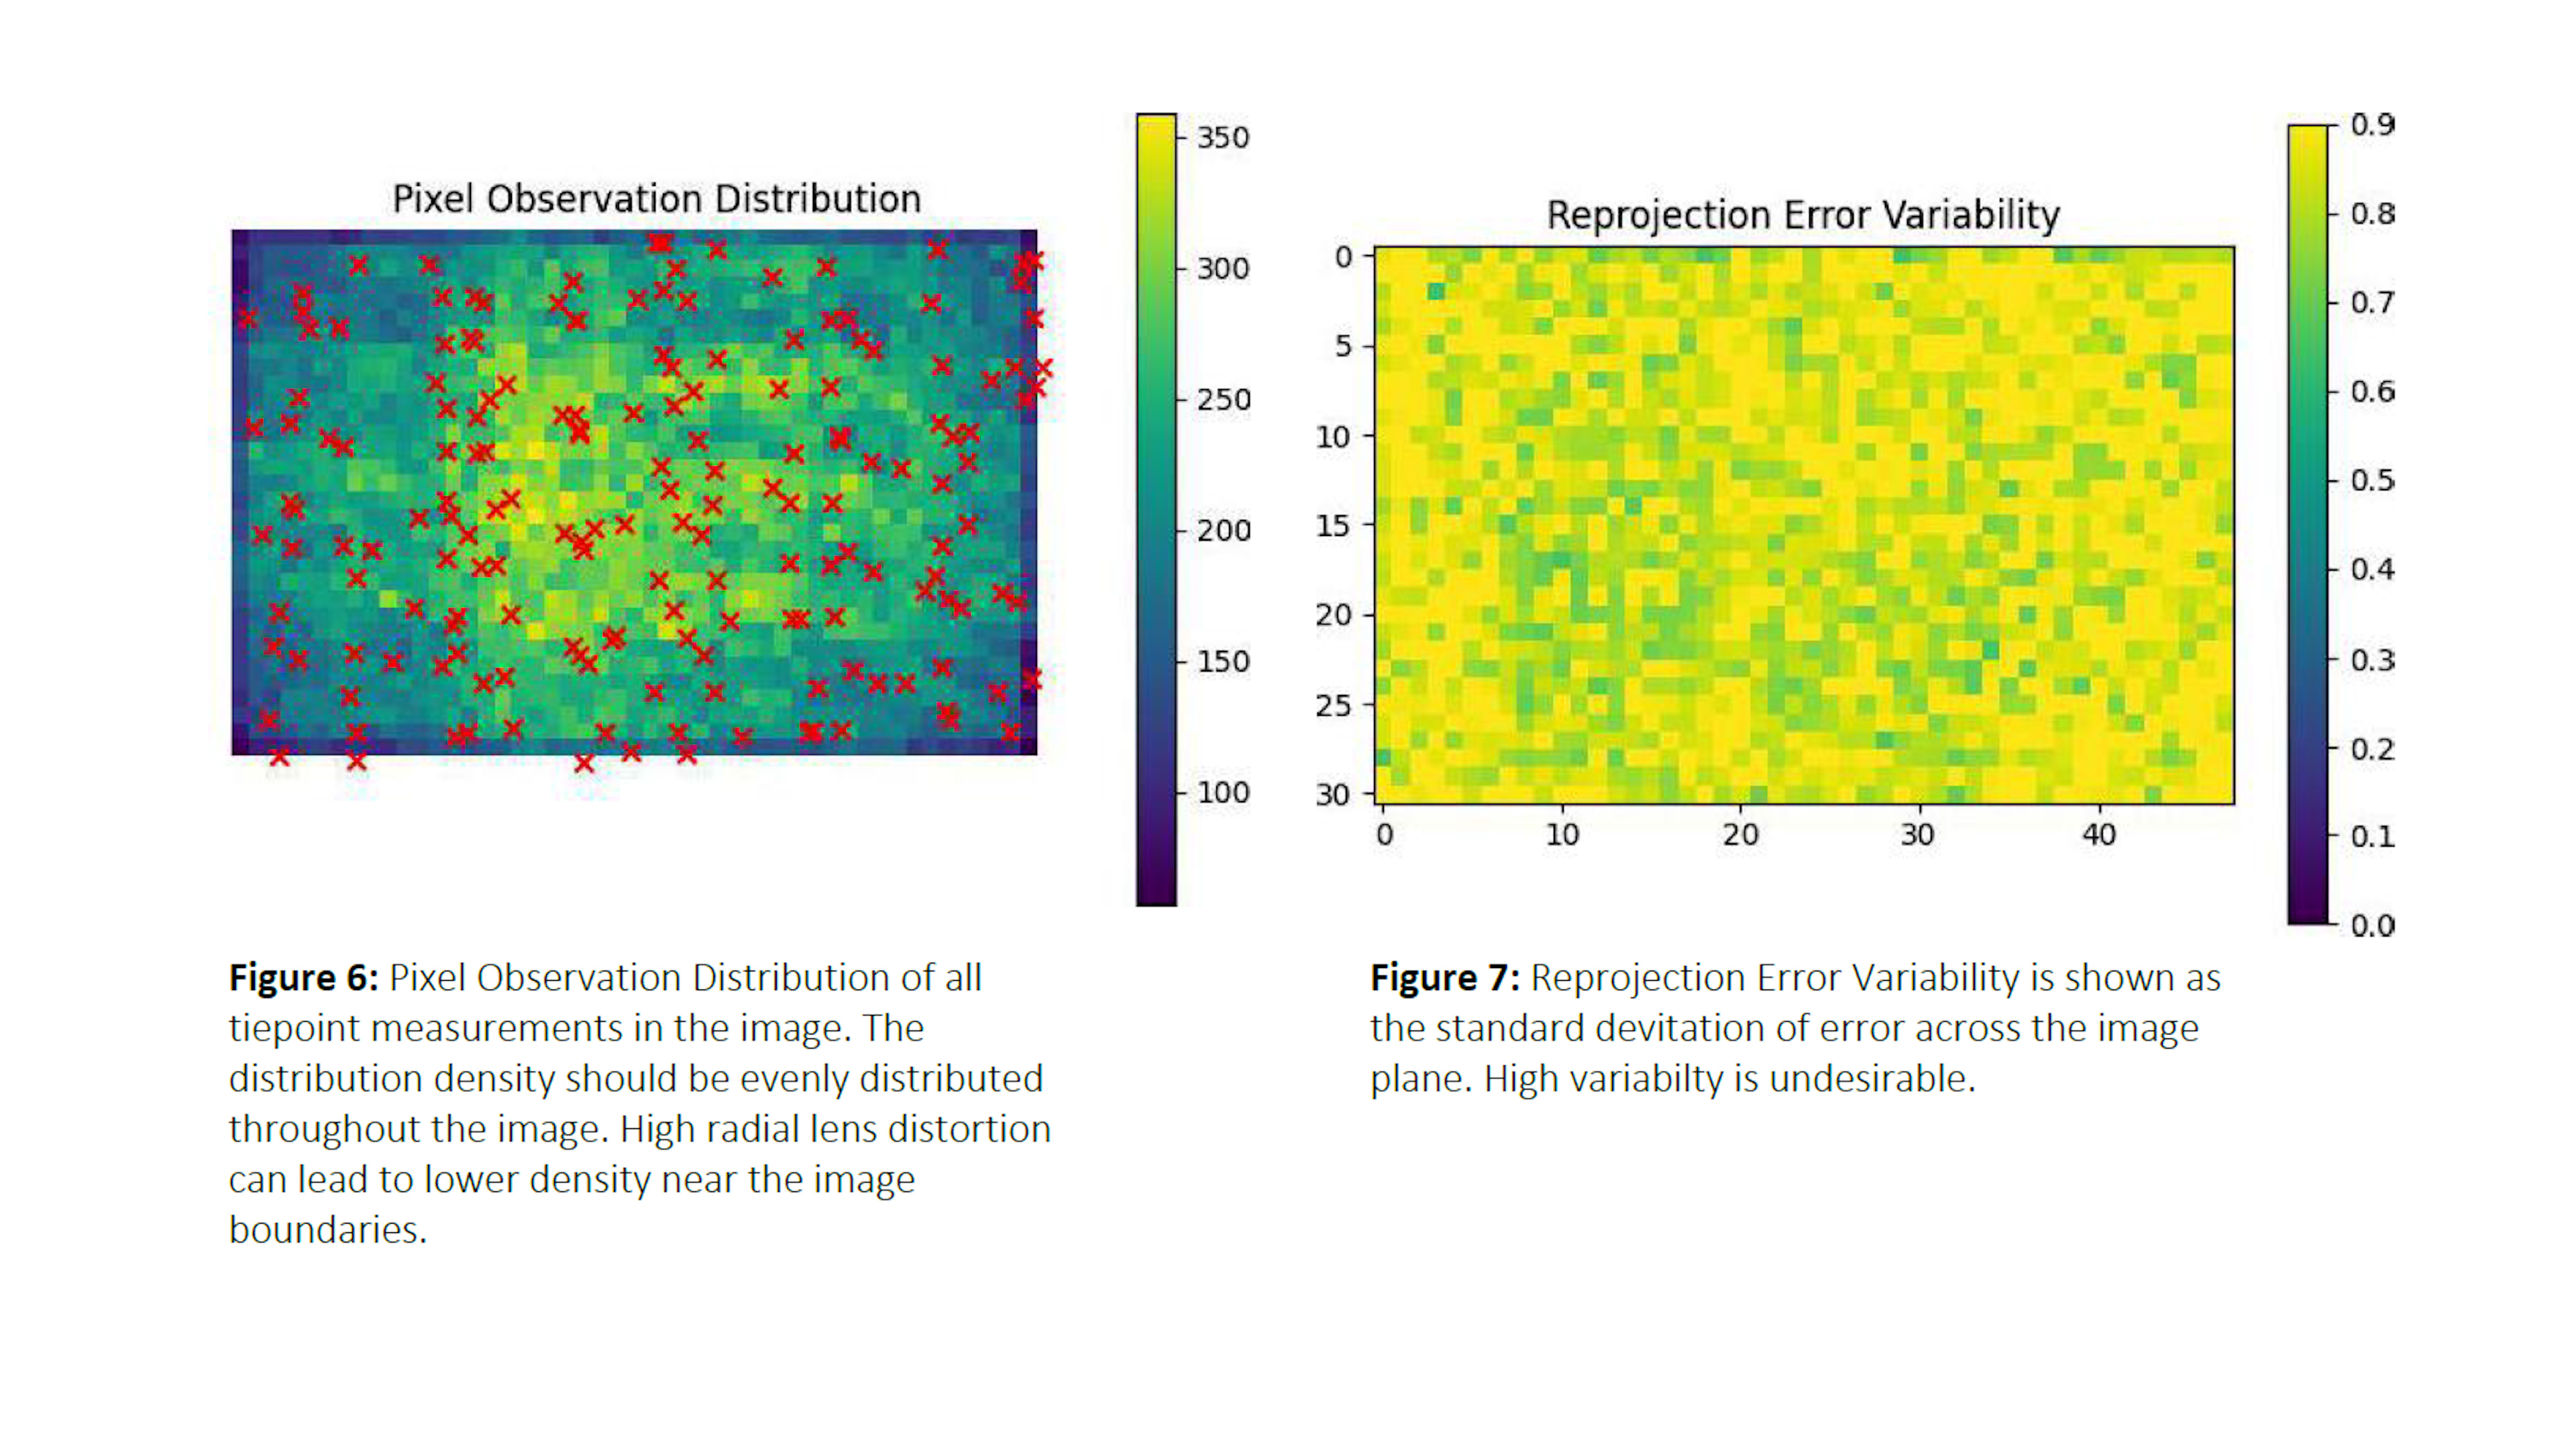
The Pixel Observation Distribution graph illustrates the distribution of observed pixels in relation to their corresponding ground positions within the imagery. It provides insight into the density and uniformity of pixel observations across the image. If you have Ground Control Points, the overlap of these will appear as red x’s on this graph, as you can see in figure 6.
Figure 7 displays the variability of reprojection errors across the image plane. It shows how the reprojection errors fluctuate as a function of camera lens distortion across the image plane and how reliably the internal parameters of the camera, such as the focal length, principle point, and radial distortion, are modeled as part of the bundle adjustment process. Ideally, reprojection errors will have a normal distribution of error throughout the image plane. However, under certain conditions, there may be correlation between parameters, which typically will be systematically visible in the Reprojection Error Variability graph.
Reprojection Error & Covariance Matrix
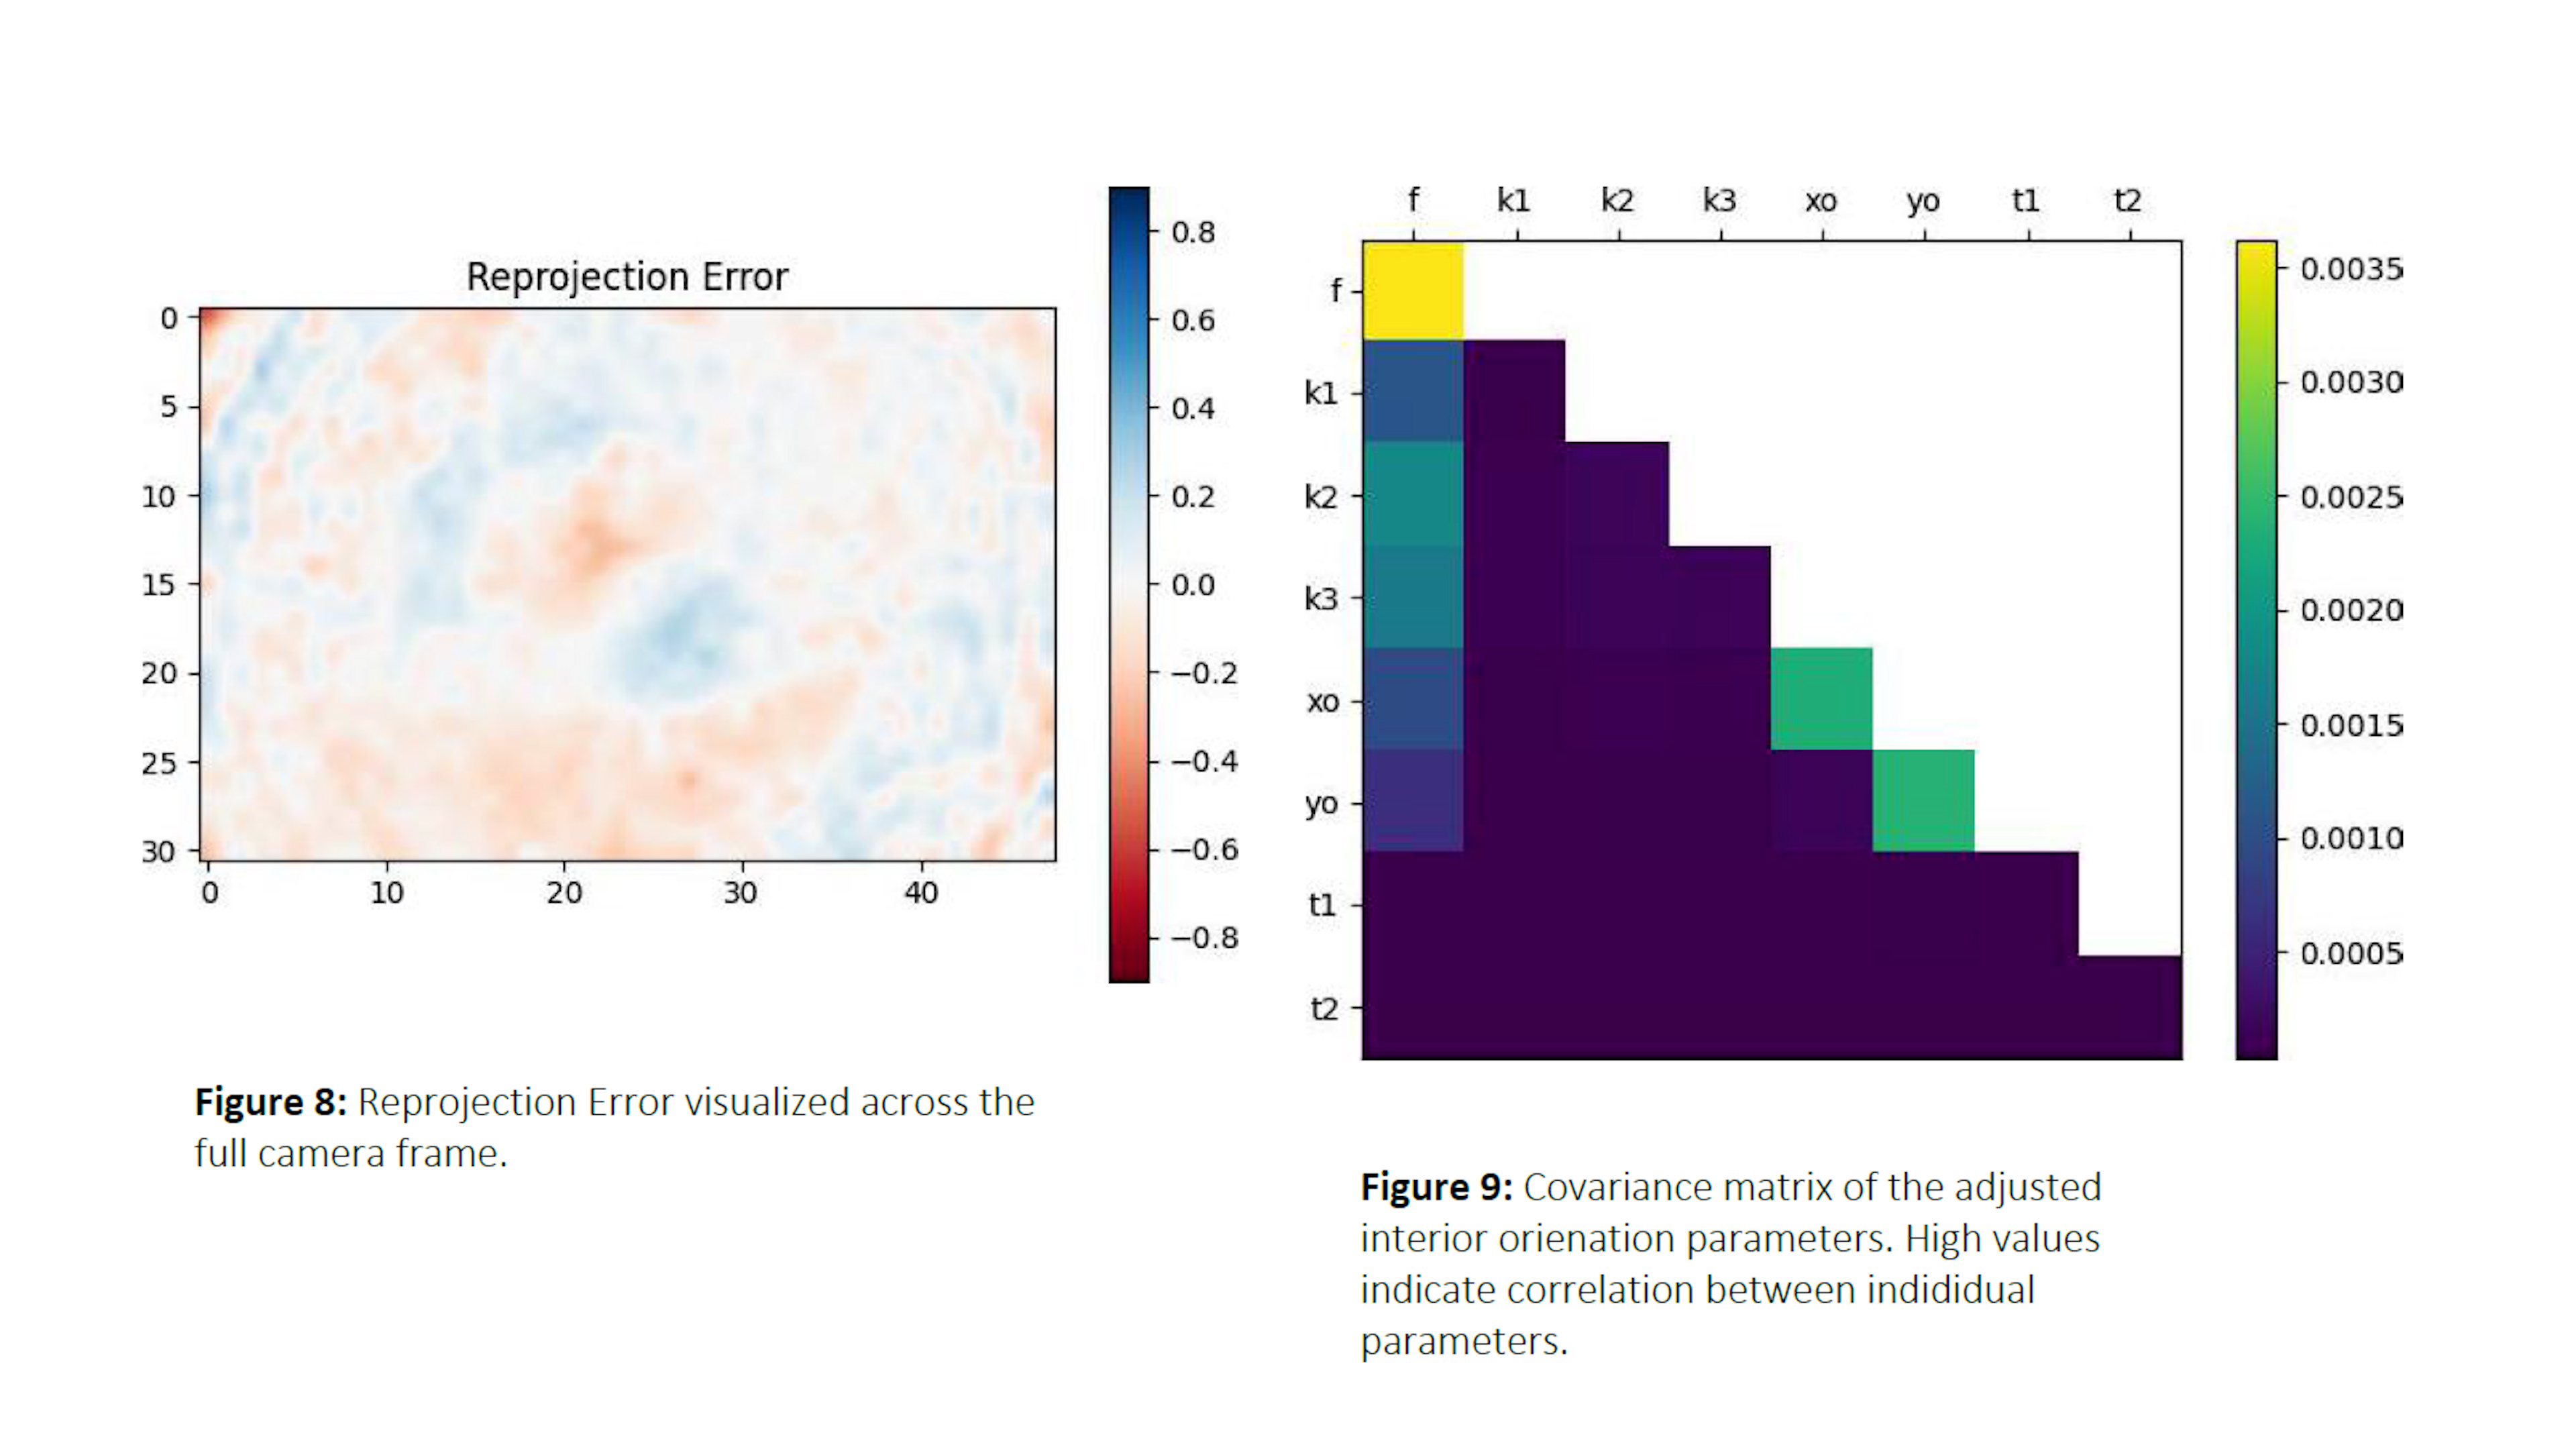
Like the pixel distribution, the Reprojection Error figure shows the discrepancies between observed image points and their corresponding projections.
The last graph (figure 9) is the covariance matrix which helps ensure the accuracy and precision of the photogrammetric process by accounting for the uncertainties inherent in the estimation of interior orientation parameters.
Reference Point Error Review
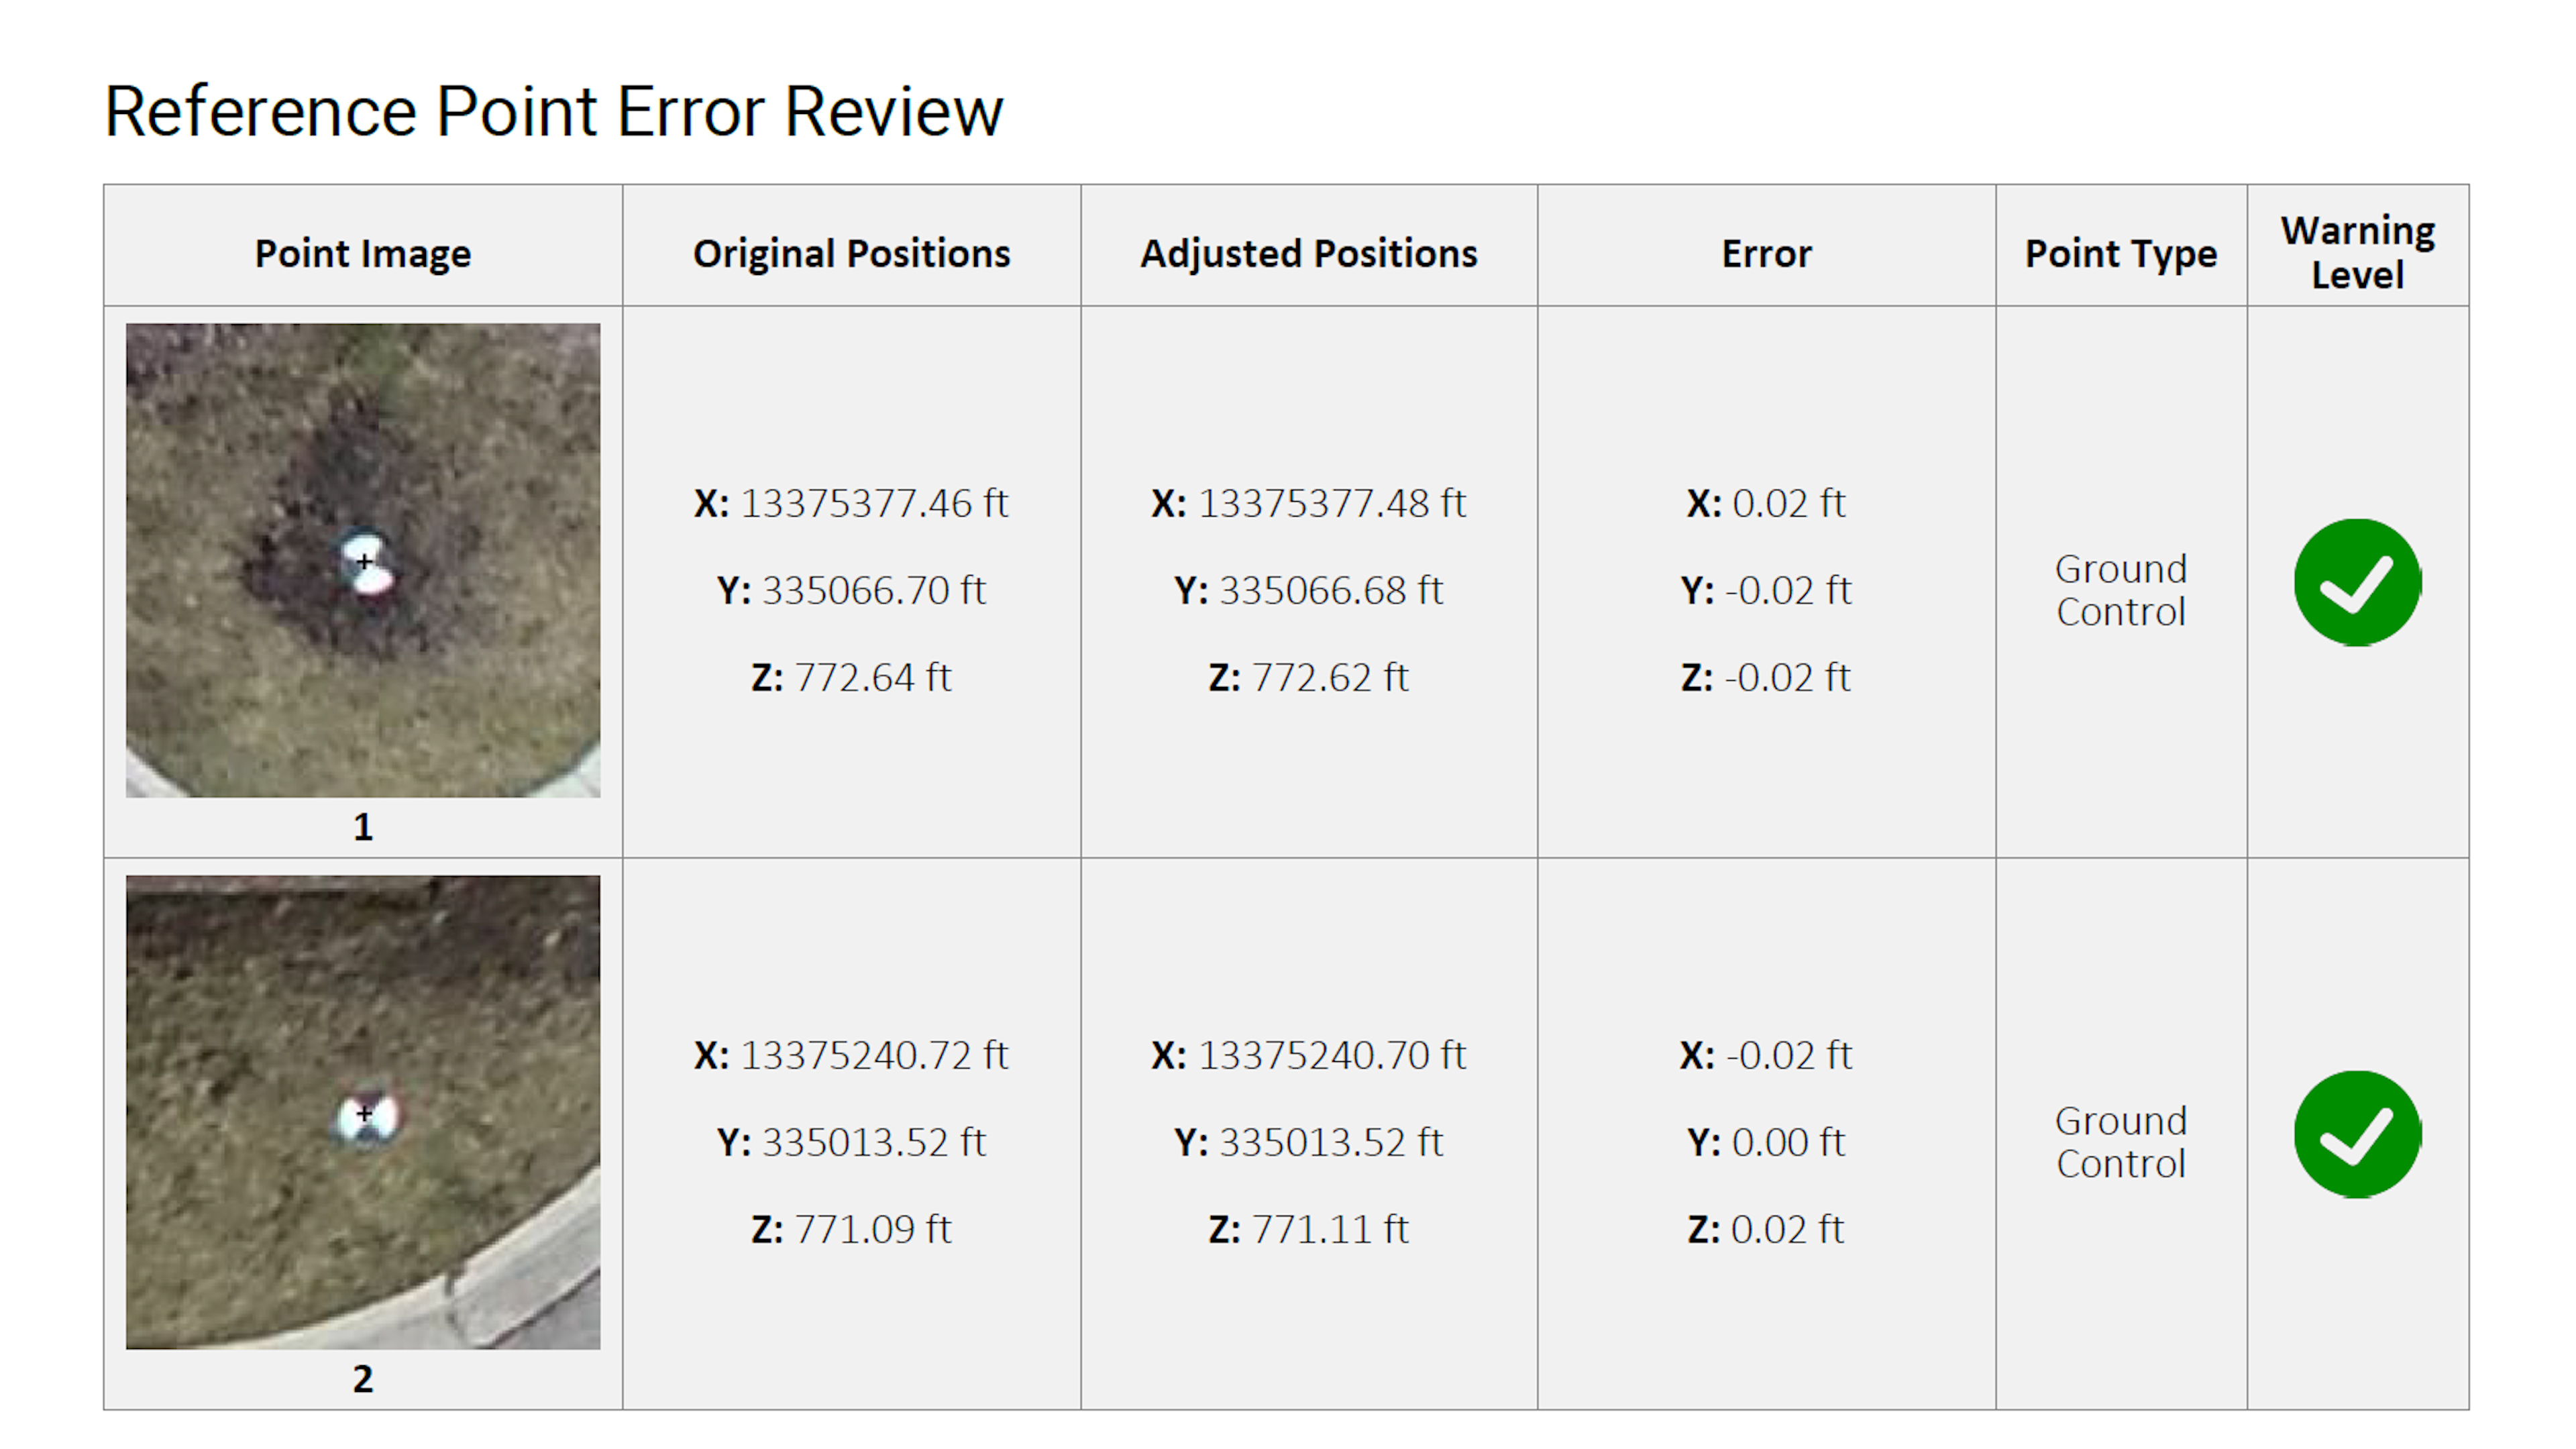
If you have any Ground Control Points, Checkpoints or Tiepoints that have been added, they will also be displayed in this report with their respective information - and will be updated in the report as you add them.
Please see the next tutorial for an in-depth look at the rest of the deliverables. See our previous blog posts for more tutorials on how to use PixElement.
A full playlist of video tutorials on how to use PixElement are available here.